Hindi: आप इस लेख को हिंदी में भी पढ़ सकते है|
Key Takeaways
- The piercing pattern signals a possible bullish reversal after a downtrend.
- It forms with two candles: a long red candle followed by a green candle that opens lower but closes above the midpoint of the first.
- Works best near a strong support level, especially with higher trading volume.
- Confirm the pattern with other technical indicators before between the two candles for stronger signals.re entering trades.
- The best setups are for day or swing trading, using the low of the first candle as a stop loss.
- This pattern is similar to dark cloud cover, but points to an upward move instead of a drop.
- Key Takeaways
- What is a Piercing Pattern?
- Anatomy of the Piercing Pattern Formation
- Characteristics of a Valid Piercing Pattern
- How to Trade the Piercing Pattern Effectively
- Practical Trading Example
- Enhancing Success with Technical Indicators
- Ideal Trading Timeframes
- Common Mistakes to Avoid
- Piercing Pattern vs. Similar Formations
- Advanced Trading Strategies
- Bottomline
- Frequently Asked Questions (FAQs)
What is a Piercing Pattern?
The piercing pattern is a powerful bullish reversal candlestick formation that signals a potential trend change from bearish to bullish. Discovered at the end of downtrends, this pattern represents a critical shift in market sentiment where buying pressure overwhelms selling momentum.
This two-candle pattern tells a story of market psychology: sellers initially dominate, pushing prices lower, but buyers aggressively step in, reclaiming more than half of the previous session’s losses. This dramatic shift often marks exhaustion of the downtrend and the beginning of an upward move.
The piercing pattern belongs to the same family as the dark cloud cover pattern. While both are two-candle reversal patterns, they signal opposite market directions: the piercing pattern indicates bullish reversals, whereas dark cloud cover warns of bearish reversals.
Anatomy of the Piercing Pattern Formation
Understanding the precise structure of this pattern is essential for accurate identification and trading success.
The Two-Candle Structure
First Candle (Bearish):
- Long red or black candle with a substantial real body
- Minimal or no upper and lower shadows (ideally a Marubozu)
- Reflects continued downtrend momentum and seller dominance
- Opens near the high and closes near the low of the session
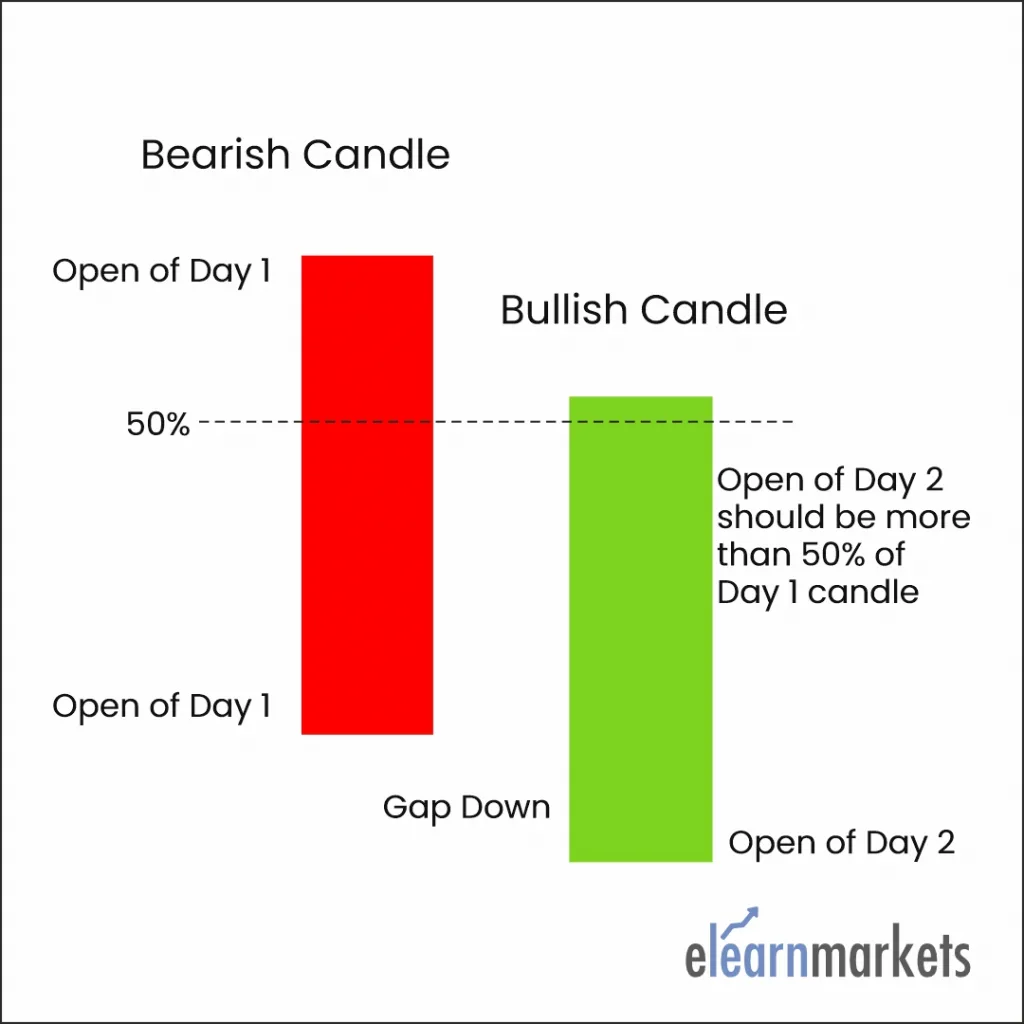
Second Candle (Bullish):
- Opens with a gap down, below the previous candle’s close
- Strong green or white candle that closes well above the first candle’s midpoint
- Must close above 50% of the first candle’s body (closer to 60-70% is stronger)
- Should have minimal shadows for maximum validity
Market Psychology Behind the Pattern
The formation reveals a fascinating battle between bulls and bears:
- Day 1: Sellers maintain complete control, pushing prices steadily lower throughout the session, closing near the lows and confirming the downtrend’s strength.
- Day 2 Opening: The gap down opening suggests continued bearish sentiment, with sellers appearing to retain dominance. This often represents capitulation by weak hands.
- Day 2 Intraday: Buyers aggressively enter the market, perhaps recognizing oversold conditions or value. The buying pressure intensifies throughout the session.
- Day 2 Close: Bulls successfully push prices significantly higher, closing above the midpoint of the previous candle. This demonstrates a clear power shift and potential trend reversal.
Characteristics of a Valid Piercing Pattern
Not all two-candle formations qualify as legitimate piercing patterns. Traders should verify these critical characteristics:
1. Preceding Downtrend: The pattern must appear after a clear downtrend with at least three consecutive lower lows. Without this context, the pattern lacks validity as a reversal signal.
2. Gap Down Opening: The second candle should open below the first candle’s close, creating a visible gap. Larger gaps indicate stronger initial bearish sentiment and make the subsequent reversal more significant.
3. Penetration Depth: The second candle must close above the 50% mark of the first candle’s body. The deeper the penetration (60-80% is ideal), the stronger the reversal signal. Closing above 80% or higher provides maximum confirmation.
4. Candle Body Size: Both candles should have substantial real bodies relative to recent price action. Small-bodied candles suggest indecision rather than conviction and produce weaker signals.
5. Volume Confirmation: Higher-than-average volume on the second candle validates the pattern. Increased volume demonstrates genuine buying interest and institutional participation, not just temporary price fluctuation.
6. Support Level Context: Patterns forming at significant support levels (previous lows, moving averages, Fibonacci retracements, or round numbers) carry greater weight and reliability.
How to Trade the Piercing Pattern Effectively
Entry Strategy
Conservative Entry (Recommended): Wait for confirmation on the third candle. Enter a long position when price breaks above the high of the bullish (second) candle. This confirmation reduces false signals but may result in a slightly higher entry price.
Aggressive Entry: Enter immediately at the close of the second candle or on the opening of the third candle. This approach maximizes potential profit but increases risk of false breakouts.
Stop Loss Placement
Position your stop loss just below the low of the piercing pattern (typically the low of the second candle). This placement:

- Defines clear risk parameters
- Protects capital if the reversal fails
- Allows the trade room to develop without premature exits
Profit Target Setting
Target 1 (Conservative): First significant resistance level or 1.5-2 times your risk (1.5:1 to 2:1 risk-reward ratio)
Target 2 (Moderate): Previous swing high or major resistance zone
Target 3 (Aggressive): Use trailing stops after achieving initial targets to capture extended moves
Risk Management Guidelines
- Never risk more than 1-2% of your trading capital on a single trade
- Use position sizing that keeps your stop loss within your risk tolerance
- Consider partial profit-taking at predetermined levels
- Adjust stops to breakeven once the trade moves favorably
Practical Trading Example
Let’s examine a real-world application using Nifty 50 daily chart –
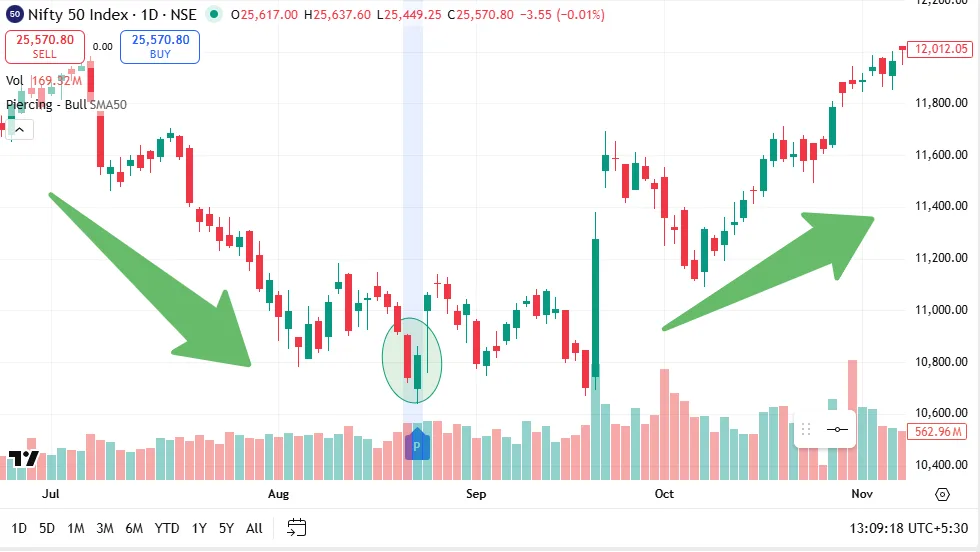
Setup:
- Stock was in a clear downtrend for several weeks
- A long red candle formed, continuing the bearish momentum
- The next day opened with a gap down but rallied strongly
- The bullish candle closed at approximately 65% of the previous candle’s body
- Volume was 35% higher than the 20-day average
- Pattern formed near a key support level at ₹10,600
Outcome: The stock reached Target 1 within five trading sessions and Target 2 within three weeks, demonstrating the pattern’s effectiveness when properly identified and traded.
Enhancing Success with Technical Indicators
Combining the piercing pattern with complementary indicators significantly improves accuracy:
RSI (Relative Strength Index): Look for oversold conditions (RSI below 30) when the pattern forms. The subsequent RSI rise above 30 confirms growing bullish momentum.
MACD (Moving Average Convergence Divergence): A bullish crossover occurring alongside or shortly after the piercing pattern provides strong confirmation of trend reversal.
Moving Averages: Patterns forming near significant moving averages (50-day or 200-day) carry additional weight. Watch for price crossing back above these averages as confirmation.
Volume Analysis: Compare the volume on the second candle to the 20-day average volume. Ideally, it should be 30-50% higher, indicating institutional accumulation.
Support and Resistance: Piercing patterns at horizontal support levels, trendline support, or Fibonacci retracement levels (38.2%, 50%, or 61.8%) offer the highest probability setups.
Ideal Trading Timeframes
Day Trading
While possible, day traders should exercise caution. Use 15-minute or 30-minute charts and wait for volume confirmation. Success rates are lower on intraday timeframes.
Swing Trading (Recommended)
Daily charts provide the optimal timeframe for piercing patterns. The pattern has greater reliability, and trades typically develop over 5-20 trading sessions.
Position Trading
Weekly charts offer the highest success rates but require patience. These setups can develop over several months and often mark major trend reversals.
Common Mistakes to Avoid
1. Ignoring the Downtrend Context: Trading piercing patterns in sideways or uptrending markets reduces effectiveness. The pattern requires a clear preceding downtrend to be valid.
2. Insufficient Penetration: Accepting patterns where the second candle closes at or below 50% of the first candle’s body significantly increases failure rates.
3. Missing Volume Confirmation: Patterns without volume support often fail. Always verify that the second candle shows increased buying interest.
4. Premature Entry: Jumping in before confirmation exposes traders to false signals. Patience for the confirmation candle improves win rates substantially.
5. Poor Stop Loss Management: Placing stops too tight or too wide creates unnecessary losses or excessive risk. Use the pattern’s structure to define logical stop levels.
6. Neglecting Overall Market Context: Even perfect patterns can fail in strongly bearish market environments. Consider broader market conditions and sector trends.
Piercing Pattern vs. Similar Formations
Bullish Engulfing Pattern
While similar, the bullish engulfing pattern has the second candle completely engulfing the first candle’s body. The piercing pattern only requires closing above 50% penetration. Bullish engulfing patterns are generally considered slightly stronger signals.
Dark Cloud Cover (Inverse)
This is the bearish counterpart to the piercing pattern. It appears at the top of uptrends and signals potential reversals to the downside with the same structural requirements but in reverse.
Hammer Pattern
A single-candle pattern also appears at downtrend ends. Less reliable than the piercing pattern but useful for early warning signs of reversals.
Advanced Trading Strategies
1. Multiple Timeframe Confirmation: Check higher timeframes for context. A piercing pattern on a daily chart has greater significance if the weekly chart also shows oversold conditions or support levels.
2. Combining with Candlestick Patterns: Look for additional confirmation patterns like Bullish Harami or Morning Star patterns forming near the same price level over subsequent sessions.
3. Sector and Market Correlation: Verify that the sector or broader market is also showing signs of bottoming. Isolated patterns in stocks moving against market trends have lower success rates.
Read More: All 35 Candlestick Chart Patterns in the Stock Market
Bottomline
The piercing pattern remains a valuable tool for traders seeking to identify high-probability bullish reversals. Its effectiveness stems from clear structure, strong psychological underpinnings, and visual simplicity. However, successful trading requires more than pattern recognition.
Master traders combine piercing patterns with comprehensive technical analysis, strict risk management, and contextual market awareness. They wait for confirmation, respect their stop losses, and remain patient for optimal setups rather than forcing trades.
As with all technical analysis tools, the piercing pattern is not infallible. It should form part of a complete trading system that includes multiple confirmation factors, appropriate position sizing, and disciplined execution. With practice and proper application, this pattern can become a cornerstone of your reversal trading strategy.
Remember: the pattern predicts the next 5-10 trading sessions most reliably. Use appropriate timeframes for your trading style, always confirm with volume and indicators, and maintain disciplined risk management to maximize your success rate.
Frequently Asked Questions (FAQs)
1. What is the minimum penetration requirement for a piercing pattern?
The second candle must close above 50% of the first candle’s body. However, penetration of 60-70% or higher provides stronger signals and higher success rates.
2. How reliable is the piercing pattern?
Success rates typically range from 60-70% on daily charts when properly confirmed with volume and support levels. Reliability decreases significantly on lower timeframes and without confirmation.
3. Can piercing patterns appear in uptrends?
While similar formations may appear in uptrends, they’re not technically piercing patterns, which by definition signal reversal from downtrends. Such formations in uptrends should be treated as continuation patterns with less reliability.
4. What’s the typical profit potential from a piercing pattern?
The pattern typically predicts moves lasting 5-20 trading sessions on daily charts. Profit potential varies but commonly reaches the next major resistance level, often providing 2:1 to 3:1 risk-reward ratios.
5. Should I always wait for confirmation?
For most traders, yes. Waiting for the third candle to break above the pattern high reduces false signals substantially. Aggressive traders may enter at the close of the second candle but should use tighter position sizing.
6. What if the volume on the second candle is low?
Low volume significantly weakens the pattern’s reliability. Consider it a warning sign and either avoid the trade or wait for additional confirmation through subsequent price action and volume expansion.


Simple and very focussed .
Hi,
Thank you for reading our blog!!
Keep Reading!