Elearnmarkets - Financial Market Learning
  • Courses
  • Webinars
  • Stories
  • Language
    • English
    • Hindi
    • Bengali
No Result
View All Result
Get Free Course
  • Basic Finance
  • Derivatives
    • Futures
    • Options
  • Financial Planning
  • Fundamental Analysis
  • Technical Analysis
  • Mutual Funds
  • Marketshala
  • Miscellaneous
Elearnmarkets - Learn Stock Market, trading, investing for Free
  • Courses
  • Webinars
  • Stories
  • Language
    • English
    • Hindi
    • Bengali
No Result
View All Result
Get Free Course
Elearnmarkets - Learn Stock Market, trading, investing for Free
No Result
View All Result
Home Fundamental Analysis
5 Ways to evaluate Life Insurance Companies 1

5 Ways to evaluate Life Insurance Companies

Elearnmarkets by Elearnmarkets
November 21, 2024
in Fundamental Analysis, Sector Analysis
Reading Time: 5 mins read
6
45.8k
VIEWS
Share on FacebookShare on XShare on WhatsApp

Investing in Life insurance companies may appear risky as these businesses consist of long-term products and services, and also require high initial acquisition costs.

Therefore, a financial statement that provides the current year’s realized income, with the entire acquisition cost charged upfront, provides an incomplete picture of value creation and profitability is what one should look at on investing in these companies.

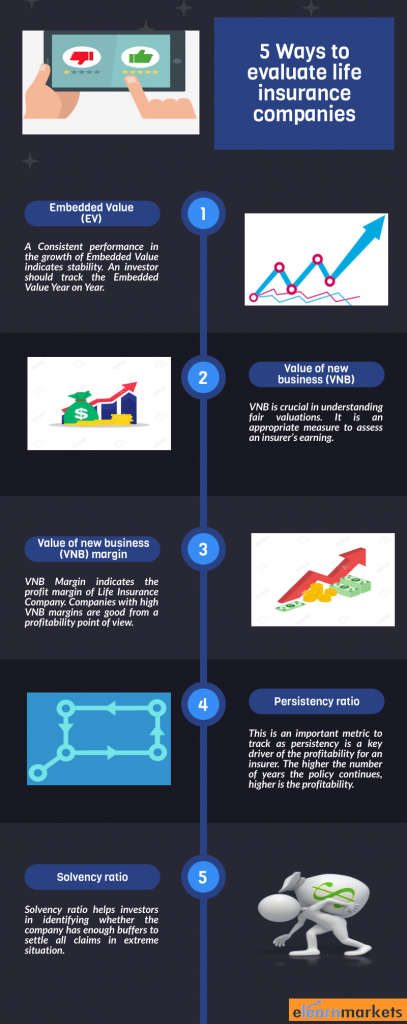
So, we will discuss some key financial parameters that you can use to analyze Life Insurance (LIC) companies before investing in them.

Table of Contents
Embedded Value(EV)
Value of new business(VNB)
Value of new business (VNB) margin
Persistency Ratio
Solvency Ratio
Key Takeaways

1. Embedded Value (EV)

Embedded Value is a measure of the value of the Life insurance Company. This is an important metric, which reflects the expected profitability from the current underwritten policies plus current net worth.

EV is computed as the sum of the adjusted net worth (ANW) and the discounted value of profits from in-force policies (VIF).

Consistent performance in the growth of Embedded Value indicates stability.

Companies that experience huge dips or spikes are required to be tracked closely as any change in product strategy, distribution model, expense performance, persistency gets reflected in the EV. An investor should track the EV Year on year.

2. Value of new business (VNB)

Value of new business is used to measure the profitability of the new business written in a period. It is the present value of all future profits to shareholders measured at the time of writing the new business contract.

VNB is crucial in understanding fair valuations. It is an appropriate measure to assess an insurer’s earning.

life insurance-companies

3. Value of new business (VNB) margin

VNB margin is the most important metric that a shareholder must track.

VNB margin indicates the profit margin of Life Insurance Company.

VBN margin is calculated by dividing the Value of New Business by Annualized Premium Equivalent (Regular Premium +10% of Single Premium).

Forex:- A VBN margin of 20% would mean that if the insurer underwrote a new business premium for a particular mix of products of Rs. 100 in a year, the expected profit over the lifetime of that business is Rs.20.

Companies with high VNB margins are good from a profitability point of view.

Insurers derive higher VNB margins from their protection business. If a company wants to improve its margins, they have to focus more on the protection business.

4. Persistency Ratio

Persistency ratio measures how long customer persists with their policies. This is an important metric to track as persistency is a key driver of the profitability for an insurer.

The global average of 13th-month persistency (a policy that renews after a year) is close to 90% whereas the 61st-month persistency (a policy that renews after 5 years) is about 65%.

For example:- If the 61ST-month Persistency ratio of a company is 50%, it means half of the company customers are not paying a premium after five years.

Persistency is an important metric to consider while evaluating stocks of a life insurance company and should compare with global benchmarks. The higher the number of years the policy continues, higher is the profitability.

5. Solvency Ratio

The solvency ratio defines how good or bad an insurance company’s financial situation is on defined solvency norms.

According to Insurance Regulatory and Development Authority of India (IRDAI) guidelines, all companies are required to maintain a solvency ratio of 150% to minimize bankruptcy risk.

The solvency ratio is calculated as the amount of Available solvency margin (AMS) in relation to the amount of Required Solvency Margin (RSM).

(The ASM is the value of the company’s assets over liabilities, and RSM is based on net premiums and defined as per IRDAI guidelines.)

The solvency ratio helps investors in identifying whether the company has enough buffers to settle all claims in an extreme situations. It is a good indicator of an insurance company’s financial capacity to meet both its short-term and long-term liabilities.

All these metrics mentioned above are important factors in evaluating the fundamentals of a life insurance company.

Key Takeaways

  • These metrics should be compared with life insurance company’s peers to decide whether one should invest in that particular stock or not.

  • Insurance penetration in India continues to be low, which means there is greater scope for multi-year growth.

  • Digitization and its fastest implementation will help the life insurance companies to grow their business.

  • An investor should also include some of the softer parameters such as the brand image, which to determines the valuations.

Tags: intermediatelife insuranceSolvency ratioValue of new business (VNB)
Share26TweetSend
Get Kotak Offer Get Kotak Offer Get Kotak Offer
Previous Post

Major loops between Standalone vs Consolidated Financial Statements

Next Post

Trading with Ichimoku Cloud indicator

Elearnmarkets

Elearnmarkets

Elearnmarkets (ELM) is a complete financial market portal where the market experts have taken the onus to spread financial education. ELM constantly experiments with new education methodologies and technologies to make financial education effective, affordable and accessible to all. You can connect with us on Twitter @elearnmarkets.

Related Posts

Top 5 Valuation Ratios in the Stock Market 2
Fundamental Analysis

Top 5 Valuation Ratios in the Stock Market

May 5, 2025
820
price to sales ratio
Fundamental Analysis

Price to Sales Ratio: A Key Metric for Understanding Company Value

May 5, 2025
445
Gearing Ratio
Fundamental Analysis

What Is the Gearing Ratio? Formula & Calculation

December 3, 2024
1.1k
Top 5 Fundamental Analysis Tools 3
Fundamental Analysis

Top 5 Fundamental Analysis Tools

January 31, 2025
4.1k

Comments 6

  1. Palak Kumar saha says:
    6 years ago

    Effective

    Reply
    • Sakshi Agarwal says:
      6 years ago

      Hi Palak,

      Thank you for reading!

      Keep Reading!

      Reply
  2. Abhinav Temani says:
    4 years ago

    Very helpful, was reading a research report on a life Insurance company, and exactly these metrics were highlighted there.

    Reply
    • Sakshi Agarwal says:
      4 years ago

      Hi,

      Thank you for Reading!

      Keep Reading!

      Reply
  3. Khaleeq ur rehmam says:
    4 years ago

    Thanks for writing such a usefull points for insurer professional

    Reply
    • Sakshi Agarwal says:
      4 years ago

      Hi,

      Thank you for Reading!

      Keep Reading!

      Reply

Leave a Reply Cancel reply

Your email address will not be published. Required fields are marked *

Disclaimer

Elearnmarkets (Kredent InfoEdge Pvt. Ltd.) is a SEBI-registered Research Analyst (RA) entity (SEBI Registration No.: INH300007493). The information provided in this article is for educational and informational purposes only and should not be considered as an offer to buy or sell any securities or investment products.

The stocks, securities, and investment instruments mentioned herein are not recommendations under SEBI (Research Analysts) Regulations, 2014. Readers are advised to conduct their own due diligence and seek independent financial advice before making any investment decisions.

Investments in securities markets are subject to market risks. Please read all related documents carefully before investing. Investing in Equity Shares,
Derivatives, Mutual Funds, or other instruments carry inherent risks, including potential loss of capital. Elearnmarkets (Kredent InfoEdge Pvt. Ltd.) does not provide any guarantee or assurance of returns on any investments. Past performance is not indicative of future performance.

Elearnmarkets Logo

Follow Us

Facebook-f X-twitter Instagram Linkedin-in Youtube Telegram

Register on Elearnmarkets

Continue your financial learning by creating your own account on Elearnmarkets.com

Register Free Account

Download App

Playstore logo
Download on app store

Categories

  • Basic Finance
  • Derivatives
  • Financial Planning
  • Fundamental Analysis
  • Technical Analysis
  • Mutual Funds
  • Miscellaneous

Popular On Elearnmarkets

  • Market Superheroes:
  • Vivek Bajaj
  • Chetan Panchamia
  • Ashish Kyal
  • Premal Parekh
  • Abhijit Paul
  • Jegan
  • Sivakumar Jayachadran
  • Jyoti Budhia
  • Vivek Gadodia
  • Vishal Mehta
  • Piyush Chaudhry
  • Santosh Pasi
  • Gomathi Shankar
  • Market Superheroes:
  • Vivek Bajaj
  • Chetan Panchamia
  • Ashish Kyal
  • Premal Parekh
  • Abhijit Paul
  • Jegan
  • Sivakumar Jayachadran
  • Jyoti Budhia
  • Vivek Gadodia
  • Vishal Mehta
  • Piyush Chaudhry
  • Santosh Pasi
  • Gomathi Shankar
  • Courses:​
  • Options Trading
  • Dow Theory
  • Momentum Trading
  • Stock Investing
  • Harmonic Chart Patterns
  • Algo Trading
  • Elliot Wave Theory
  • Advanced Excel
  • Cryptocurrency
  • NSE Certification Course
  • Courses:​
  • Options Trading
  • Dow Theory
  • Momentum Trading
  • Stock Investing
  • Harmonic Chart Patterns
  • Algo Trading
  • Elliot Wave Theory
  • Advanced Excel
  • Cryptocurrency
  • NSE Certification Course
  • Webinars:
  • Bank Nifty Scalping
  • Intraday Trading Strategies
  • Options Trading Strategies
  • Options selling
  • Price Action
  • Relative Strength
  • Tax Planning
  • Options Buying
  • Growth Stocks
  • Portfolio Management
  • Risk Management
  • Renko Charts
  • Crude Oil
  • Traders Psychology
  • Moving Average
  • Multibagger Stocks
  • Free Learning Modules:
  • Intraday Trading
  • Options Scalping
  • Swing Trading
  • Financial Modelling
  • RSI Indicator
  • Bollinger Bands
  • Pricing of Futures
  • Personal Finance
  • Initial Public Offerings (IPO)
  • Value Investing
  • Technical Indicators
  • Candlesticks
  • Chart Patterns
  • Option Greeks
  • ELSS Funds
  • Banking and Insurance
  • Real Estate
  • Gold
  • Book Summaries:
  • Rich Dad Poor Dad
  • Psychology of Money
  • The Intelligent Investor
  • The Richest Man in Babylon
  • Think and Trade Like a Champion
  • Value Investing and Behavioural Finance
  • Trading in the Zone
  • Learn to Earn
  • Book Summaries:
  • Rich Dad Poor Dad
  • Psychology of Money
  • The Intelligent Investor
  • The Richest Man in Babylon
  • Think and Trade Like a Champion
  • Value Investing and Behavioural Finance
  • Trading in the Zone
  • Learn to Earn
  • Tools:
  • CAGR Calculator
  • SIP Calculator
  • eLearnOptions
  • Future Value Calculator
  • Present Value Calculator
  • Atal Pension Yojana
  • Cost of Delay Calculator
  • Become a Crorepati
  • Tools:
  • CAGR Calculator
  • SIP Calculator
  • eLearnOptions
  • Future Value Calculator
  • Present Value Calculator
  • Atal Pension Yojana
  • Cost of Delay Calculator
  • Become a Crorepati

© 2025 Elearnmarkets. All Rights Reserved

  • Visit Elearnmarkets
  • Courses
  • Webinars
  • Financial Guides
  • Get Free Counselling
  • Visit Elearnmarkets
  • Courses
  • Webinars
  • Financial Guides
  • Get Free Counselling

Download Our App

No Result
View All Result
  • Article Categories
    • Basic Finance
    • Derivatives
    • Financial Planning
    • Fundamental Analysis
    • Technical Analysis
    • ETFs & Mutual Funds
    • Marketshala
    • Miscellaneous
  • Language
    • Hindi
    • Bengali
    • English
  • Courses
  • Webinars
  • Stories
Get Free Course

© 2024 Elearnmarkets All Rights Reserved

Guide to Basics of Stock Investing
Learn to interpret the financial performance and health of a company.
Download Guide For FREE
Trading Day 2025