
Do you know that there is an old saying in business that cash is king? Yes! For any small business, cash drives its income as it provides the business with the means to remain solvent for operating.
Business solvency occurs when there is enough investment in assets for covering its debt or liabilities by the company. Solvency ratios help us in measuring the extent to which a business can cover its liabilities during more than one year on in the year. These ratios help us in accurately measuring a firm’s liquidity and solvency compared to the ratios derived from either the income statement or balance sheet.
We should know how to develop and apply the information that we obtained from these ratios. So, in today’s blog, we will discuss 5 ratios for cash flow analysis. But before that let us discuss what actually the cash flow statement tells us:
What does the Cash Flow statement tell us?
This statement is one of the three financial statements that a business owner uses for analysing cash flow. Cash flow is the fund that flows into and out of a business and helps in operating the business of companies.
This statement breaks down the firm’s cash flows into three categories: operating, financing and investing cash flows. Operating cash flows refers to the increases and decreases in the current asset and current liability over a period. Financing cash flows refers to the funding to the business or the return of funding. And finally, investing cash flows refers to the investing activities by the firm into any securities, property, plant, or equipment.
So, when we analyse these with balance sheet and income statement data, we get to know the information of the firm’s wealth so it can use it for financial analysis of its cash position. Thus it’s important for the investors to do cash flow investment analysis,
Now let us discuss the different types of cash flow ratios:
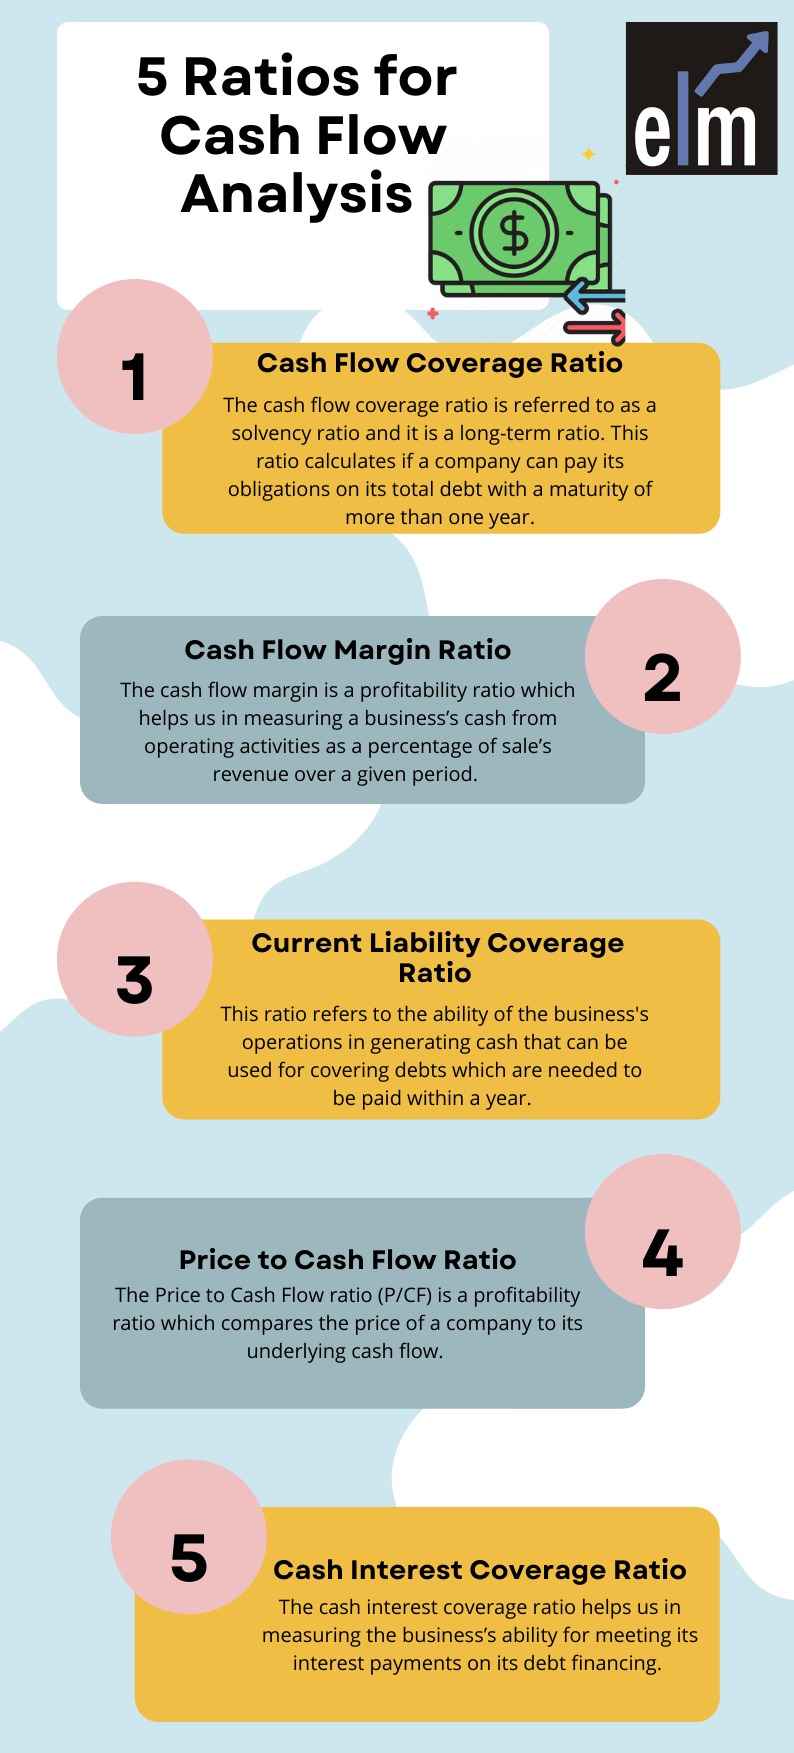
1. Cash Flow Coverage Ratio
This ratio is referred to as a solvency ratio and it is a long-term ratio. This ratio calculates if a company can pay its obligations on its total debt with a maturity of more than one year. If the ratio is greater than 1.0, then the company is not in danger of default.
The formula for calculating this ratio is:
Cash Flow Coverage Ratio=Net Cash Flow from Operations/Total Debt
Pros-
This ratio does a good job in the terms that if there is a temporary slow-down in earnings hit the company, then the current obligations would still be met and the business could make it though only for a short time.
Cons-
Lending is not the only time when cash flow coverage becomes important. Investors also want to know how much cash is left with a company after paying debts. After all, shareholders are generally last in line in liquidation, so they can feel bad when most of the company’s cash is going to pay debtors instead of raising the value of the company.
2. Cash Flow Margin Ratio
This ratio is a profitability ratio that helps us in measuring a business’s cash from operating activities as a percentage of sale’s revenue over a given period. In simple words, it tells us how well the business can convert sales to cash. The analysis of this ratio is important for companies as it provides insight into a business’s profitability, and also the quality of its earnings.
The formula for calculating this ratio is:
Cash Flow Margin Ratio= (Net Income + Non-Cash Expenses (Amortization and Depreciation) + Change in Working Capital) / Sales
Pros-
The cash flow margin measures the efficiency with which a company turns sales into cash. As this ratio is based on transactions that involve money which is been transferred, rather than projections, it’s a good indicator of earnings quality. Cash flow margin ratio analysis can be also a great way for comparing competitors within the same industry, as cash flow itself is driven by operational efficiency and revenues.
Cons-
When we look at cash flow margins, it’s important to remember that companies usually adjust cash flows from their operations. If you’re an investor using cash flow margin ratio analysis for evaluating a company, it’s worth looking at this ratio over an incremental period of time, as it provides us with a much more comprehensive overview of the profitability of the business.
3. Current Liability Coverage Ratio
This ratio refers to the ability of the business’s operations in generating cash that can be used for covering debts which are needed to be paid within a year. In simple words, the current liability coverage ratio helps in measuring the business’s liquidity.
This ratio is also known as the cash current debt coverage ratio, which looks at how the business’s dividend policy affects the cash available to meet its current debt obligations.
The ratio is calculated as follows:
Current Liability Coverage Ratio= (Net cash from operating activities-cash dividends)/Average Current Liabilities
Pros-
Coverage ratio helps in determining the movements in the position of a company from one period to another. If the ratios are increasing, then the profits of the company are outperforming the financial liabilities consistently and vice versa. It also signals improvement or decline in the company’s financial position.
Cons-
The cover ratios can be easily manipulated so the investors need to be careful while looking at the coverage ratios.
4. Price to Cash Flow Ratio
This ratio is a profitability ratio which compares the price of a company to its underlying cash flow. It is a valuation parameter that shows the company’s based on the cash flow generated by it. In simple words, it shows the dollar value that an investor is willing to pay for the cash flow that is generated by the firm. Investors use this ratio for analysing a company’s valuation with one of the most important considerations – cash.
The formula for calculating this ratio is:
Price to Cash Flow Ratio=Market Capitalization/Operating cash flow
Pros-
P/CF is one of the most used ratios in the investment industry. Investors when investing in any company should know the company’s valuation with respect to the cash it generates from the underlying operations. Cash flow analysis with respect to price helps us in comparing different companies in the same industry irrespective of certain accounting differences.
Cons-
One should note that P/CF is a powerful tool to value companies having positive cash flow but might also have negative cash earnings because of large non-cash items. On the other hand, this ratio becomes useless if a company is not generating positive cash flows. Thus, P/CF should be analysed with valuation ratios such as the PE Ratio and Dividend Yield.

Join our course on EVALUATING FINANCIAL PERFORMANCE USING RATIO AND FUNDS FLOW ANALYSIS
5. Cash Interest Coverage Ratio:
The cash interest coverage ratio helps us in measuring the business’s ability for meeting its interest payments on its debt financing. It is a similar measure to the interest coverage ratio, but as it uses cash and not earnings in the denominator, it is more of a realistic measure. If the ratio is less than one, then we can say that the business does not have enough cash for meeting its interest obligations on its short and long-term debt.
The formula for calculating cash interest coverage ratio is-
Cash Interest Coverage Ratio= (Earnings before Interest and Taxes + Non-cash expense)/Interest Expense
Pros-
Cash Interest Coverage Ratio is one of the effective ratios for measuring any firm’s ability to meet its interest on its debt financing.
Cons-
One should note that interest coverage is a highly variable metric when measuring companies in different sectors and even when measuring companies within the same industry.
Using Cash Flows Ratios in StockEdge:
StockEdge helps us to know the cash flow ratios of the companies in which we are planning to invest as shown below:

Bottomline:
Large and small businesses should be aware of the firm’s cash position at all times. These ratios are the best measures in terms of the liquidity, solvency, and long-term viability of a business firm. These ratios are sometimes reserved for advanced financial analysis. When it comes to analysing small businesses, cash is very important for their survival. It would serve a business owner for calculating the cash flow ratios to have an accurate picture of the actual cash position as well as the viability of the business. The viability of the business refers to its ability to survive in the long run and also as a measure of the effectiveness of its operations.
We hope that you found this blog informative and use the information to its maximum potential in the practical world. Show some love by sharing this blog with your family and friends and help us in our mission of spreading financial literacy.
Happy Investing!


