Key Takeaways
- Hanging Man signals a potential bearish reversal at the top of an uptrend, showing increased selling pressure.
- Dark Cloud Cover forms when a bearish candle opens above and closes deep into the prior bullish candle, indicating a shift in sentiment.
- Bearish Engulfing occurs when a large red candle completely engulfs the previous green one, suggesting strong bearish control.
- Evening Star is a three-candle reversal pattern that indicates buyer exhaustion and the start of a downtrend.
- Three Black Crows consist of three long bearish candles in a row, reflecting sustained selling pressure and trend reversal confirmation.
After having a basic understanding of candlestick chart patterns, let’s dive into Bearish Candlestick Patterns that indicate the ongoing uptrend which is going to end and it may reverse to the downtrend.
These Bearish Reversal Candlestick Patterns can be single or multiple candlestick patterns.
One should note that:
- Bearish reversal patterns should form at the end of an uptrend. Otherwise, it will act just like a continuation pattern.
- One should confirm the reversal signals given by bearish reversal patterns with other indicators such as volume and resistance.
In this blog, we will be discussing 5 Powerful Bearish Candlestick Patterns:
5 Powerful Bearish Candlestick Patterns
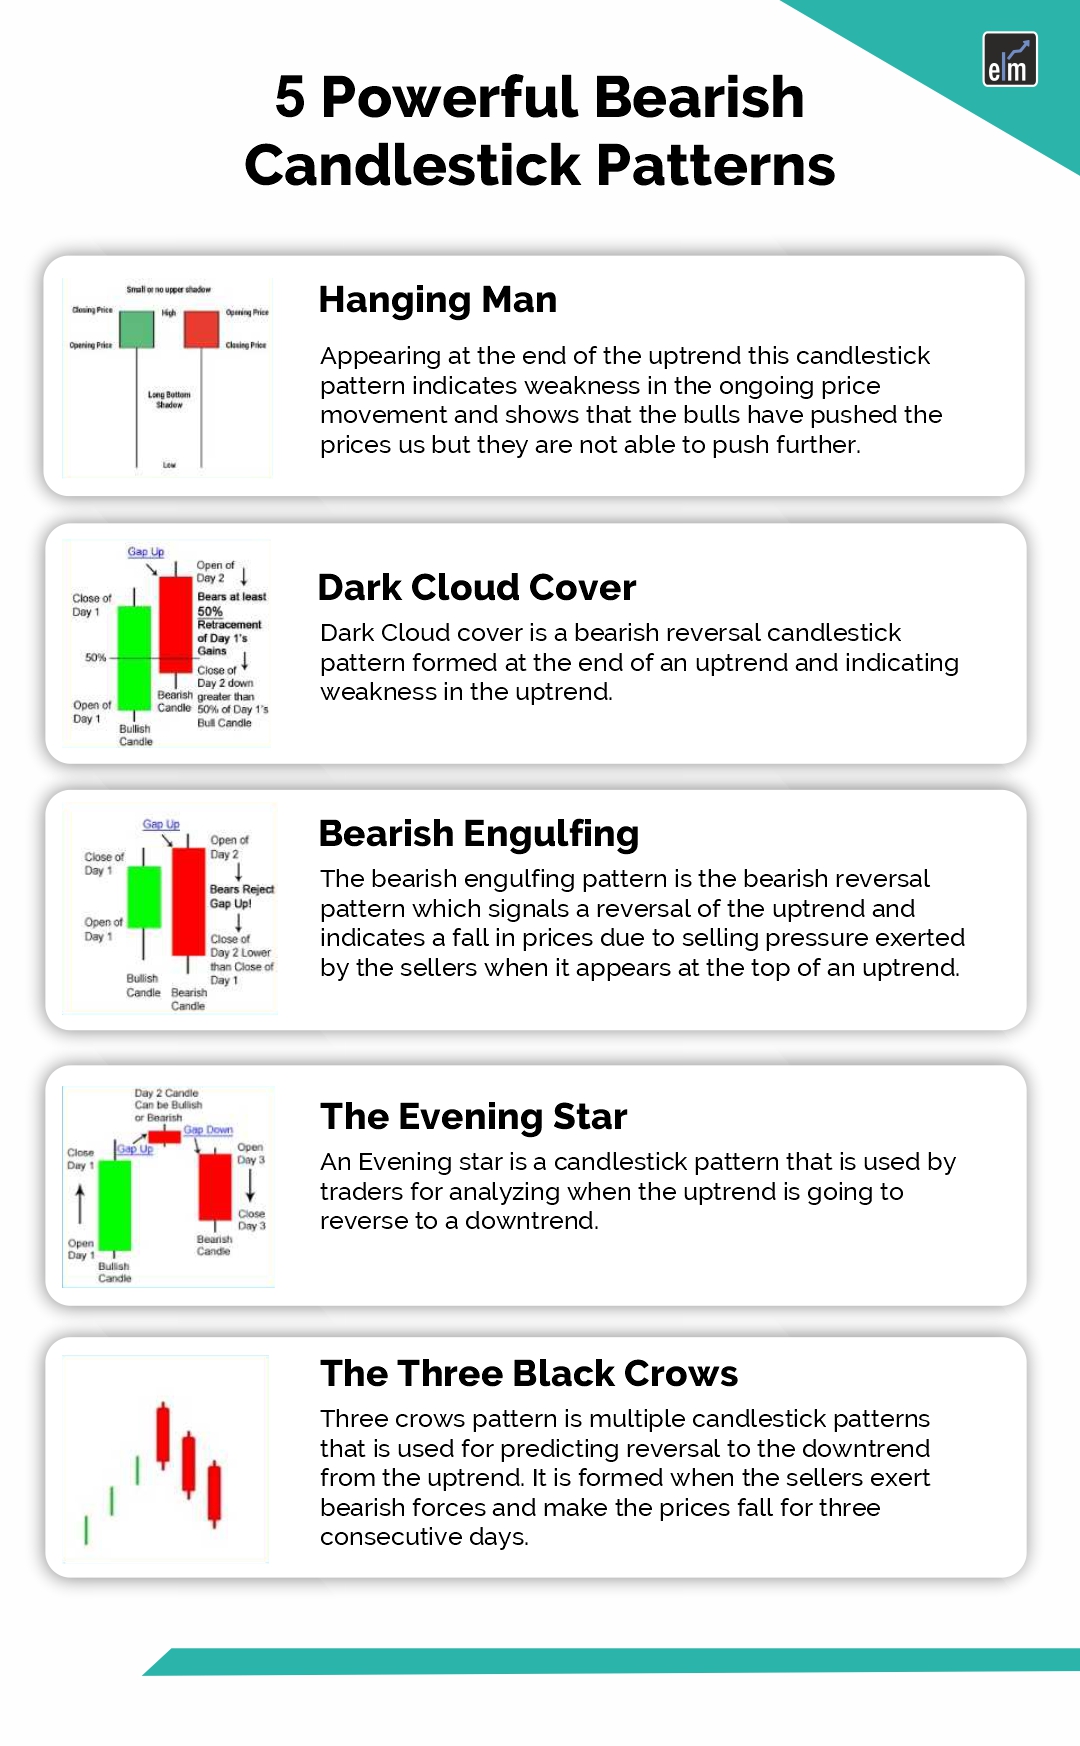
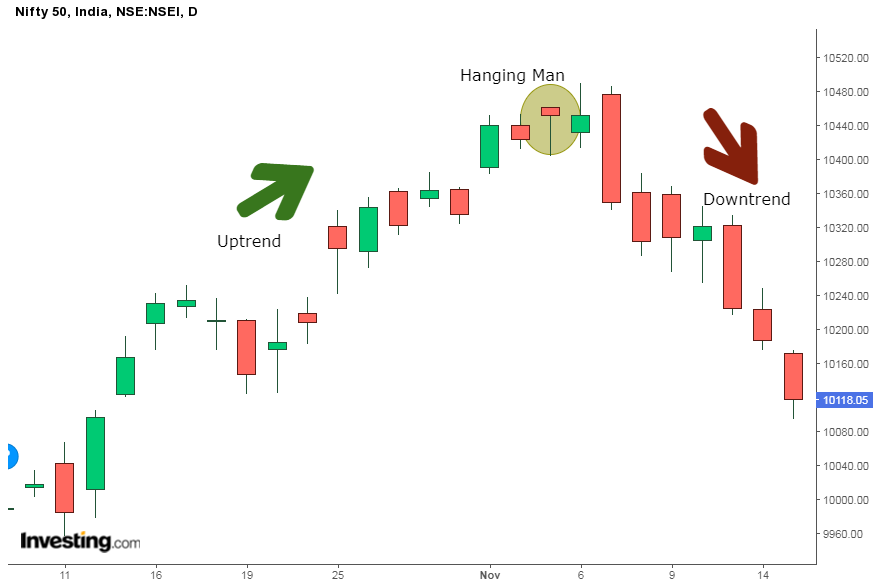
1. Hanging Man
Hanging man is a bearish reversal candlestick pattern having a long lower shadow with a small real body.
Appearing at the end of the uptrend, this bearish candlestick pattern indicates weakness in the ongoing price movement and shows that the bulls have pushed the prices up but they are not able to push further.
It has a small real body which indicates a small distance between the opening and closing price. The lower shadow should be twice the length of its body and there is no upper shadow.
This pattern helps the traders to square their buy position and enter a short position.
Below is an example of the formation of the Hanging Man on the Daily chart of Nifty 50 below:
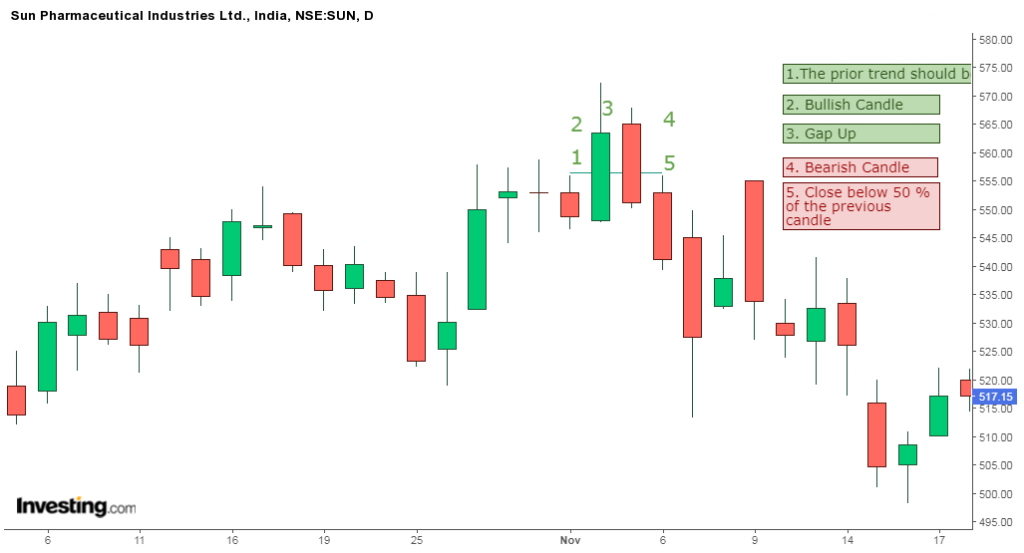
2. Dark Cloud Cover
Dark Cloud Cover is a bearish reversal candlestick pattern formed at the end of an uptrend and indicating weakness in the uptrend.
This candlestick pattern is made of two candlesticks, the first being a bullish candlestick and the second one being a bearish candlestick.

As the prices rise, this pattern becomes important for the reversal to the downside.
Below is an example of the Dark Cloud Cover in the daily chart of Sun Pharmaceutical Industries Ltd.
3. Bearish Engulfing
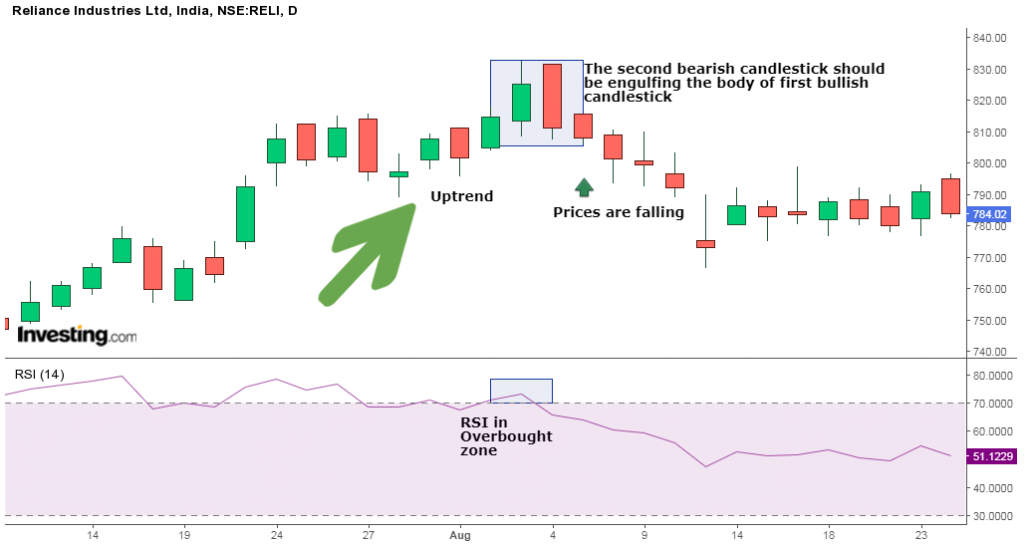
The bearish engulfing pattern is the bearish reversal pattern which signals a reversal of the uptrend and indicates a fall in prices due to the selling pressure exerted by the sellers when it appears at the top of an uptrend.
This pattern triggers a reversal of the ongoing uptrend as sellers enter the market and make the prices fall.
The pattern is formed by two candles with the second bearish candle engulfing the ‘body’ of the previous green candle.
Learn how to trade with bearish and bullish engulfing patterns
Below is an example of the Bearish Engulfing pattern as shown in the daily chart of Reliance Industries:
4. The Evening Star
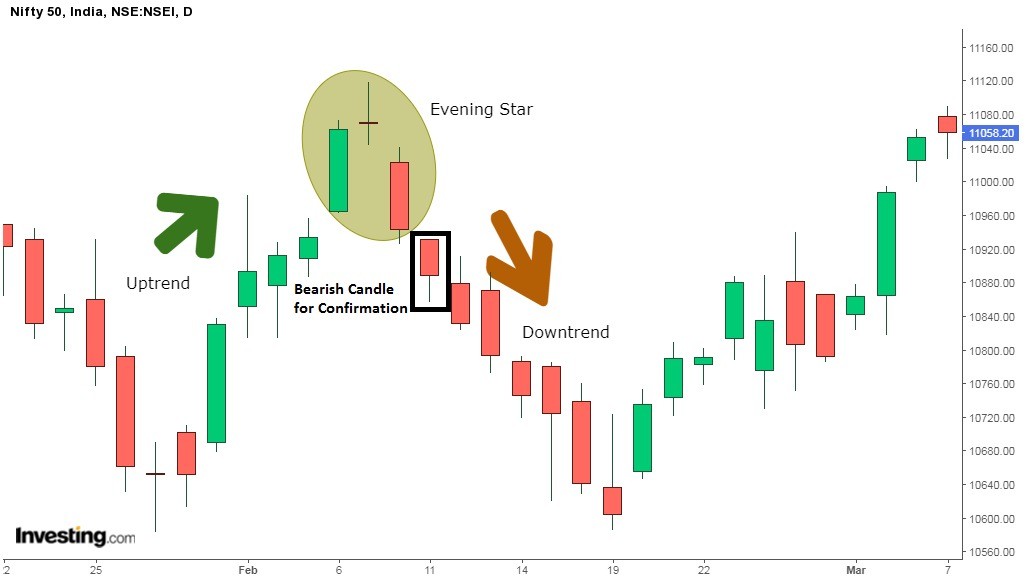
An Evening Star is a candlestick pattern that is used by traders for analyzing when the uptrend is going to reverse to a downtrend.
This candlestick pattern consists of three candlesticks: a large bullish candlestick, a small-bodied candle, and a bearish candlestick.
Evening Star patterns appear at the top of the uptrend and signal that the uptrend is going to reverse to a downtrend
Below is an example of the Evening Star pattern formed in the Nifty 50 chart below:
5. The Three Black Crows
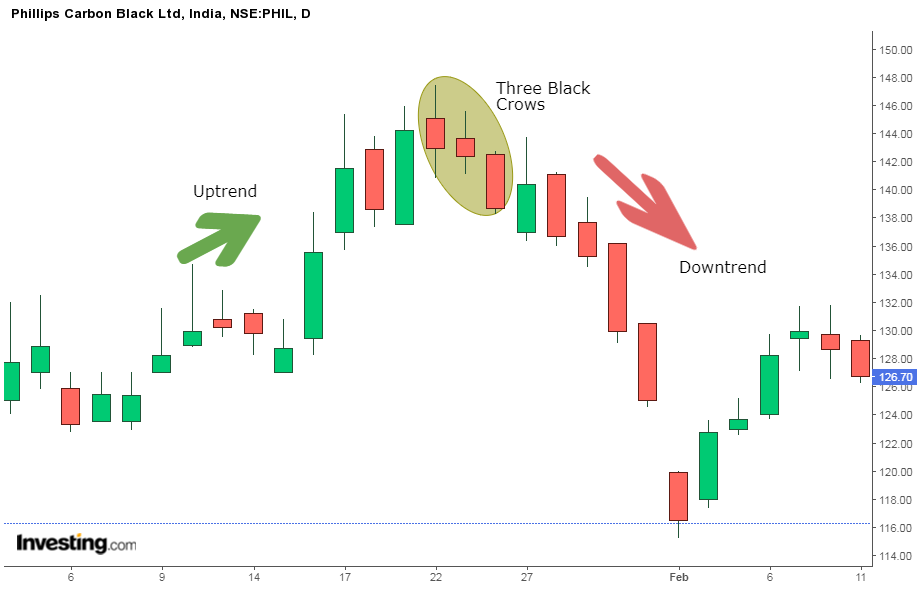
Three Crows pattern is a multiple candlestick pattern that is used for predicting the reversal of the downtrend from the uptrend.
It is formed when the sellers exert bearish forces and make the prices fall for three consecutive days.
Traders can take a short position after the bearish candlestick pattern is formed.
Traders should take the help of volume and technical indicators to confirm the formation of this candlestick pattern.
Below is an example of the daily chart of Phillips Carbon Black Ltd. that the Three Black Crows Candlestick pattern :
To know about other candlesticks, read our blog on All 35 Candlestick Chart Patterns in the Stock Market-Explained
Bottomline
Hanging man is a bearish reversal candlestick pattern having a long lower shadow with a small real body. Dark Cloud Cover is a bearish reversal candlestick pattern formed at the end of an uptrend and indicating weakness in the uptrend. The bearish engulfing pattern is the bearish reversal pattern that signals a reversal of the uptrend and indicates a fall in prices due to the selling pressure exerted by the sellers when it appears at the top of an uptrend. An Evening Star is a candlestick pattern that is used by traders for analyzing when the uptrend is going to reverse to a downtrend. Three Crows pattern is a multiple candlestick pattern that is used for predicting the reversal of the downtrend from the uptrend. To learn more about these patterns in detail, refer to our technical analysis PDF.
Visit us: https://blog.elearnmarkets.com/5-powerful-bearish-candlestick-patterns/
Frequently Asked Questions (FAQs)
What are bearish candlestick patterns?
On price charts, bearish candlestick patterns are formations that suggest future declines in the market. They offer visual indicators of the mood of the market and possible price movement, indicating that there is a good chance the asset’s price will drop.
What is the 3 candle rule in trading?
A big down candle, a smaller up candle enclosed in the previous candle, and then another up candle that closes above the close of the second candle make up the bullish reversal pattern known as the “three inside up pattern.”
How can you tell if a candle is bearish?
When sellers outweigh purchasers during an uptrend, a bearish engulfing pattern forms. A long red (black) real body swallowing a small green (white) real body reflects this action. The trend suggests that sellers are in charge again and that the price may drop further.
How to Identify Bullish and Bearish Candlestick?
To identify bullish and bearish candlesticks, you need to check the open and close prices. A bullish candle forms when the price closes higher than it opened. This shows buyers are strong. A bearish candle forms when the price closes lower than it opened. This means sellers are in control.
Should I buy or sell bearish candle?
If a bearish candle appears after an uptrend, it usually means sellers are taking control, so you should consider selling but if it forms after a downtrend near a support level, wait for confirmation of reversal before buying, as one bearish candle alone is not enough to decide.


Great!
Hi,
Thank you for reading our blog!!
Keep Reading!
very nice
Hi,
We are glad that you liked our post, you can read more blogs on Technical Analysis from here.
Thank you for Reading!
Great explanation
Thanks 😊 🙏
Hi,
We really appreciated that you liked our blog.
Keep Reading!
Basic & very strong cocnept
Hi,
We really appreciated that you liked our blog! Thank you for your feedback!
Keep Reading!