Elearnmarkets - Financial Market Learning
  • Courses
  • Webinars
  • Stories
  • Language
    • English
    • Hindi
    • Bengali
No Result
View All Result
Get Free Course
  • Basic Finance
  • Derivatives
    • Futures
    • Options
  • Financial Planning
  • Fundamental Analysis
  • Technical Analysis
  • Mutual Funds
  • Marketshala
  • Miscellaneous
Elearnmarkets - Learn Stock Market, trading, investing for Free
  • Courses
  • Webinars
  • Stories
  • Language
    • English
    • Hindi
    • Bengali
No Result
View All Result
Get Free Course
Elearnmarkets - Learn Stock Market, trading, investing for Free
No Result
View All Result
Home Basic Finance
Understanding the India VIX- A Guide On Volatility Index India 1

Understanding the India VIX- A Guide On Volatility Index India

Vivek Bajaj by Vivek Bajaj
March 4, 2025
in Basic Finance
Reading Time: 9 mins read
0
3.1k
VIEWS
Share on FacebookShare on XShare on WhatsApp

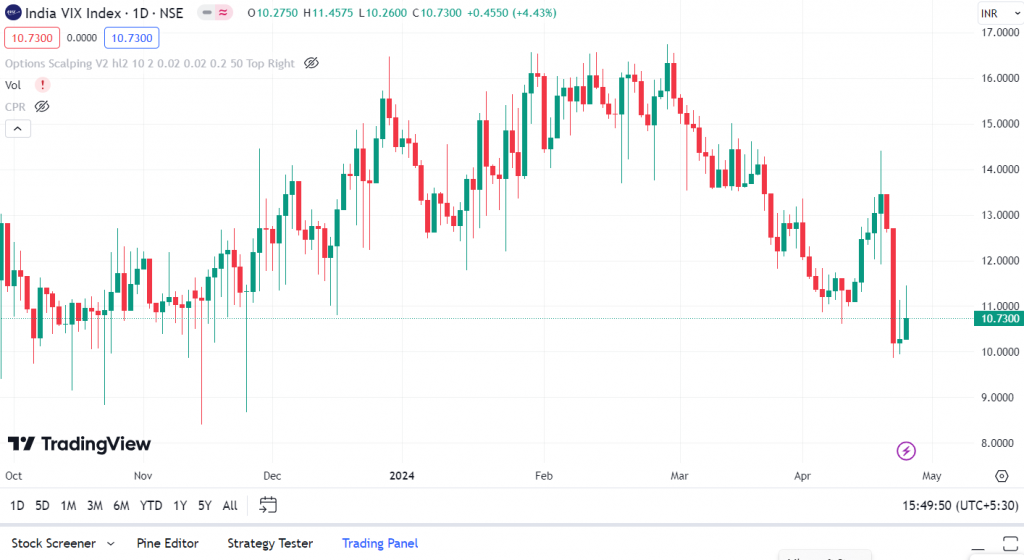
You may have recently heard that India Vix has fallen around 20% to 10? But what does this index is and why is there so much buzz around it?

The term India VIX is undoubtedly one that you have encountered if you are a relatively novice investor in the market and are still learning the many terminology used in the marketing sector..

For the past ten years, the Indian Volatility Index (VIX) has been used in stock market analysis. It is likely that you have observed that when the VIX is low (below 15), the Nifty rises, and when the Nifty is above 22, it tends to fall sharply. 

The VIX is also known as the Fear Index because, although having no inherent meaning, it serves as a general indicator of market worry. Equity markets respond badly to fear when predicted volatility is high, which also raises the fear factor. This explains the opposite direction that the VIX and Nifty are heading.

In today’s blog, let us discuss about this volatility index in detail-

Table of Contents

  • What is the India VIX?
  • What is Market Volatility?
  • What is the Role of the India VIX?
  • How is the India VIX calculated?
  • What is the Relationship between the India VIX and Market Sentiment?
  • Interpreting India VIX Levels
    • 1. High India VIX (Above 20-25)
    • 2. Moderate India VIX (15-20)
    • 3. Low India VIX (Below 15)
    • 4. Interpreting Changes in VIX
  • Conclusion 
  • Frequently Asked Questions (FAQs)
    • What is the India VIX?
    • How is the India VIX calculated?
    • What does the India VIX indicate?

What is the India VIX?

The term “Volatility Index India,” often known as “India VIX,” refers to a gauge of the Nifty 50 Index options’ anticipated volatility for the ensuing thirty days. It can be computed using the Black-Scholes model and could indicate what the market anticipates will happen to the Nifty 50 in the near future.

India VIX

Based on its S&P 100 Index option prices, the Chicago Board of Options Exchange (CBOE) first established it in 1993. The NSE adopted this methodology, launching the India VIX in 2008 and VIX Futures in 2014.

What is Market Volatility?

The market’s risk and uncertainty are reflected in volatility. Lower volatility denotes more steady and predictable market swings, whereas higher volatility indicates more quick and significant price changes.

 Numerous variables can impact market volatility, such as the publication of economic data, developments in geopolitics, corporate earnings reports, shifts in interest rates or monetary policy, investor mood, and external shocks (such as natural catastrophes or political unrest).

What is the Role of the India VIX?

The VIX is a straightforward indicator of the predicted volatility or risk in the markets, but its practical application is the more pressing concern. Here are six methods to follow:

  1. The VIX is a reliable and excellent indicator of market risk for equity traders.It helps these short-term and intraday stock traders determine whether market volatility is increasing or decreasing. They might adjust their plan of action accordingly. For instance, intraday traders face the risk of stop losses being swiftly triggered when there is a high likelihood of volatility spikes. As a result, they have the option of lowering their leverage or increasing their stop losses.
  2. 2. For long-term investors, VIX is also a highly useful indicator. Long-term investors often don’t worry too much about short-term volatility. However, there are restrictions on risk and mark-to-market (MTM) losses for institutional investors and proprietary desks. They can increase their put hedges to play both sides of the market when the VIX signals increasing volatility.
  3.  Another helpful indicator for options traders is VIX. Typically, volatility is the deciding factor when buying or selling an option. Options are likely to climb in value and buyers often profit more when volatility is expected to increase. There will be increased waste when the VIX declines.
  4.  VIX is also a very helpful signal for long-term investors. Short-term volatility usually doesn’t worry long-term investors too much. For institutional investors and proprietary desks, there are limitations on risk and mark-to-market (MTM) losses. When the VIX indicates rising volatility, they can leverage both sides of the market by increasing their put hedges.
  5. VIX is an additional useful indicator for options traders. Volatility is usually the determining factor when purchasing or disposing of an option. When increased volatility is anticipated, options are likely to appreciate in value and buyers often make more money. When the VIX drops, there will be more waste.

How is the India VIX calculated?

The Nifty 50 Index options order book is the basis for calculating this index. It computes volatility using the prices of Nifty options for the next and close to the month.

What is the Relationship between the India VIX and Market Sentiment?

Understanding investor behaviour and expectations in the Indian stock market requires an understanding of the relationship between the VIX (Volatility Index) and market sentiment in India. This index can be used as a gauge of market sentiment and is intended to quantify market volatility based on options from the Nifty 50 Index.

The India VIX and market sentiment typically have an inverse relationship. In order to protect themselves from future losses or to bet on more significant price swings, investors sometimes purchase more options when they are more afraid or unclear about the direction of the market. Because there is a greater demand for options, option prices rise, which raises this index’s reading. As a result, an increasing India VIX frequently indicates increased market anxiety and unfavourable investor sentiment.

Interpreting India VIX Levels

Understanding how the values represent current market circumstances and investor expectations for future volatility in the Indian stock market is essential to interpreting India’s VIX levels. Let us interpret the levels below-

1. High India VIX (Above 20-25)

An elevated level of anxiety and uncertainty among investors is generally indicated by a high level. It implies that market players expect major price swings in the near future.

2. Moderate India VIX (15-20)

Investors who anticipate average levels of volatility are usually linked to market circumstances that have moderate VIX values.

3. Low India VIX (Below 15)

A low India VIX denotes stability and a high degree of market confidence. Investors believe there is less chance of sudden events or sharp market swings.

4. Interpreting Changes in VIX

Rising value indicates an increase in market trepidation or uncertainty. It might come before times of increased volatility or drops in the market.

A falling value frequently indicates an improvement in investor confidence and a decrease in fear. It can point to a more secure and promising future for the market.

Understanding the India VIX- A Guide On Volatility Index India 2

Conclusion 

Evaluating investor expectations, examining market mood, and determining the current risk environment are all necessary when reading this index value. For traders and investors, this index is a useful tool for making well-informed decisions and modifying their strategies in response to expected market volatility.

Join our webinar to know about the option buying strategy for trading in low VIX environment and improve your risk management techniques.

Frequently Asked Questions (FAQs)

What is the India VIX?

The implied volatility of the Nifty 50 Index options sold on the National Stock Exchange (NSE) of India is the basis for the India VIX, sometimes referred to as the Volatility Index, which is a measure of market volatility. It represents the volatility that investors anticipate over the ensuing thirty days.

How is the India VIX calculated?

The Nifty 50 Index options order book is used to construct the India VIX. It calculates the anticipated market volatility using the pricing of Nifty options for the next and close months.

What does the India VIX indicate?

This index reflects market sentiment and expectations regarding future volatility. A higher VIX value suggests higher expected volatility, indicating greater uncertainty and potential price fluctuations in the market.

For more Market Updates, Visit StockEdge

Tags: basicenglishinvestment basics
ShareTweetSend
Get Kotak Offer Get Kotak Offer Get Kotak Offer
Previous Post

Don’t Panic, Prepare-5 Proven Strategies When the Stock Market Crashes!

Next Post

7 Powerful Continuation Candlestick Patterns

Vivek Bajaj

Vivek Bajaj

Mr. Vivek Bajaj has over 18 years of trading experience in equities, options, currencies, and commodity markets. He is the co-founder of Stockedge and Elearnmarkets and is passionate about data, analytics, and technology. He serves on various exchange committees and has played a significant role in the evolution of India's derivative market. He has been a speaker at various colleges and higher institutions, including IIT and IIMs.

Related Posts

Concept of Fund of Funds
ETFs & Mutual Funds

Easy Guide to Understanding the Concept of Fund of Funds

June 3, 2025
149
How is standard deviation used in mutual fund
ETFs & Mutual Funds

How is Standard Deviation Used in Mutual Fund

April 22, 2025
525
Ways to Make Trading More Transparent
Cryptocurrency

Under the Crypto Hood: 5 Ways to Make Trading More Transparent

May 5, 2025
93
options trading books
Basic Finance

Top 5 Options Trading Books for Beginners

May 27, 2025
1.2k

Leave a Reply Cancel reply

Your email address will not be published. Required fields are marked *

Disclaimer

Elearnmarkets (Kredent InfoEdge Pvt. Ltd.) is a SEBI-registered Research Analyst (RA) entity (SEBI Registration No.: INH300007493). The information provided in this article is for educational and informational purposes only and should not be considered as an offer to buy or sell any securities or investment products.

The stocks, securities, and investment instruments mentioned herein are not recommendations under SEBI (Research Analysts) Regulations, 2014. Readers are advised to conduct their own due diligence and seek independent financial advice before making any investment decisions.

Investments in securities markets are subject to market risks. Please read all related documents carefully before investing. Investing in Equity Shares,
Derivatives, Mutual Funds, or other instruments carry inherent risks, including potential loss of capital. Elearnmarkets (Kredent InfoEdge Pvt. Ltd.) does not provide any guarantee or assurance of returns on any investments. Past performance is not indicative of future performance.

Elearnmarkets Logo

Follow Us

Facebook-f X-twitter Instagram Linkedin-in Youtube Telegram

Register on Elearnmarkets

Continue your financial learning by creating your own account on Elearnmarkets.com

Register Free Account

Download App

Playstore logo
Download on app store

Categories

  • Basic Finance
  • Derivatives
  • Financial Planning
  • Fundamental Analysis
  • Technical Analysis
  • Mutual Funds
  • Miscellaneous

Popular On Elearnmarkets

  • Market Superheroes:
  • Vivek Bajaj
  • Chetan Panchamia
  • Ashish Kyal
  • Premal Parekh
  • Abhijit Paul
  • Jegan
  • Sivakumar Jayachadran
  • Jyoti Budhia
  • Vivek Gadodia
  • Vishal Mehta
  • Piyush Chaudhry
  • Santosh Pasi
  • Gomathi Shankar
  • Market Superheroes:
  • Vivek Bajaj
  • Chetan Panchamia
  • Ashish Kyal
  • Premal Parekh
  • Abhijit Paul
  • Jegan
  • Sivakumar Jayachadran
  • Jyoti Budhia
  • Vivek Gadodia
  • Vishal Mehta
  • Piyush Chaudhry
  • Santosh Pasi
  • Gomathi Shankar
  • Courses:​
  • Options Trading
  • Dow Theory
  • Momentum Trading
  • Stock Investing
  • Harmonic Chart Patterns
  • Algo Trading
  • Elliot Wave Theory
  • Advanced Excel
  • Cryptocurrency
  • NSE Certification Course
  • Courses:​
  • Options Trading
  • Dow Theory
  • Momentum Trading
  • Stock Investing
  • Harmonic Chart Patterns
  • Algo Trading
  • Elliot Wave Theory
  • Advanced Excel
  • Cryptocurrency
  • NSE Certification Course
  • Webinars:
  • Bank Nifty Scalping
  • Intraday Trading Strategies
  • Options Trading Strategies
  • Options selling
  • Price Action
  • Relative Strength
  • Tax Planning
  • Options Buying
  • Growth Stocks
  • Portfolio Management
  • Risk Management
  • Renko Charts
  • Crude Oil
  • Traders Psychology
  • Moving Average
  • Multibagger Stocks
  • Free Learning Modules:
  • Intraday Trading
  • Options Scalping
  • Swing Trading
  • Financial Modelling
  • RSI Indicator
  • Bollinger Bands
  • Pricing of Futures
  • Personal Finance
  • Initial Public Offerings (IPO)
  • Value Investing
  • Technical Indicators
  • Candlesticks
  • Chart Patterns
  • Option Greeks
  • ELSS Funds
  • Banking and Insurance
  • Real Estate
  • Gold
  • Book Summaries:
  • Rich Dad Poor Dad
  • Psychology of Money
  • The Intelligent Investor
  • The Richest Man in Babylon
  • Think and Trade Like a Champion
  • Value Investing and Behavioural Finance
  • Trading in the Zone
  • Learn to Earn
  • Book Summaries:
  • Rich Dad Poor Dad
  • Psychology of Money
  • The Intelligent Investor
  • The Richest Man in Babylon
  • Think and Trade Like a Champion
  • Value Investing and Behavioural Finance
  • Trading in the Zone
  • Learn to Earn
  • Tools:
  • CAGR Calculator
  • SIP Calculator
  • eLearnOptions
  • Future Value Calculator
  • Present Value Calculator
  • Atal Pension Yojana
  • Cost of Delay Calculator
  • Become a Crorepati
  • Tools:
  • CAGR Calculator
  • SIP Calculator
  • eLearnOptions
  • Future Value Calculator
  • Present Value Calculator
  • Atal Pension Yojana
  • Cost of Delay Calculator
  • Become a Crorepati

© 2025 Elearnmarkets. All Rights Reserved

  • Visit Elearnmarkets
  • Courses
  • Webinars
  • Financial Guides
  • Get Free Counselling
  • Visit Elearnmarkets
  • Courses
  • Webinars
  • Financial Guides
  • Get Free Counselling

Download Our App

No Result
View All Result
  • Article Categories
    • Basic Finance
    • Derivatives
    • Financial Planning
    • Fundamental Analysis
    • Technical Analysis
    • ETFs & Mutual Funds
    • Marketshala
    • Miscellaneous
  • Language
    • Hindi
    • Bengali
    • English
  • Courses
  • Webinars
  • Stories
Get Free Course

© 2024 Elearnmarkets All Rights Reserved

Guide to Basics of Stock Investing
Learn to interpret the financial performance and health of a company.
Download Guide For FREE
How to Spot False Dips and Trade with Confidence