Elearnmarkets - Financial Market Learning
  • Courses
  • Webinars
  • Stories
  • Language
    • English
    • Hindi
    • Bengali
No Result
View All Result
Get Free Course
  • Basic Finance
  • Derivatives
    • Futures
    • Options
  • Financial Planning
  • Fundamental Analysis
  • Technical Analysis
  • Mutual Funds
  • Marketshala
  • Miscellaneous
Elearnmarkets - Learn Stock Market, trading, investing for Free
  • Courses
  • Webinars
  • Stories
  • Language
    • English
    • Hindi
    • Bengali
No Result
View All Result
Get Free Course
Elearnmarkets - Learn Stock Market, trading, investing for Free
No Result
View All Result
Home Fundamental Analysis
Top 5 Valuation Ratios in the Stock Market 1

Top 5 Valuation Ratios in the Stock Market

Vivek Bajaj by Vivek Bajaj
May 5, 2025
in Fundamental Analysis
Reading Time: 7 mins read
0
809
VIEWS
Share on FacebookShare on XShare on WhatsApp

Investing in the stock market can seem pretty intimidating, especially for new investors. One of the most effective ways to assess a company’s financial health and determine if its stock is fairly priced is through valuation ratios. 

Whether you’re a beginner learning the ropes of fundamental analysis of stocks or an experienced investor, understanding these ratios can give you an edge in your stock analysis. Think of them as the cheat codes to decode a stock’s true potential. 

Let’s explore the top five valuation ratios that every investor should know, providing a clear understanding of their significance and how you can use them effectively.

What Are Valuation Ratios?

Valuation ratios, often referred to as market value ratios, are metrics used to evaluate the relative value of a company’s shares. These ratios help you determine whether a stock is overvalued, undervalued, or fairly priced compared to its earnings, cash flow, or other financial metrics. By analysing these ratios, investors can gain insights into a company’s financial performance and make better investment choices.

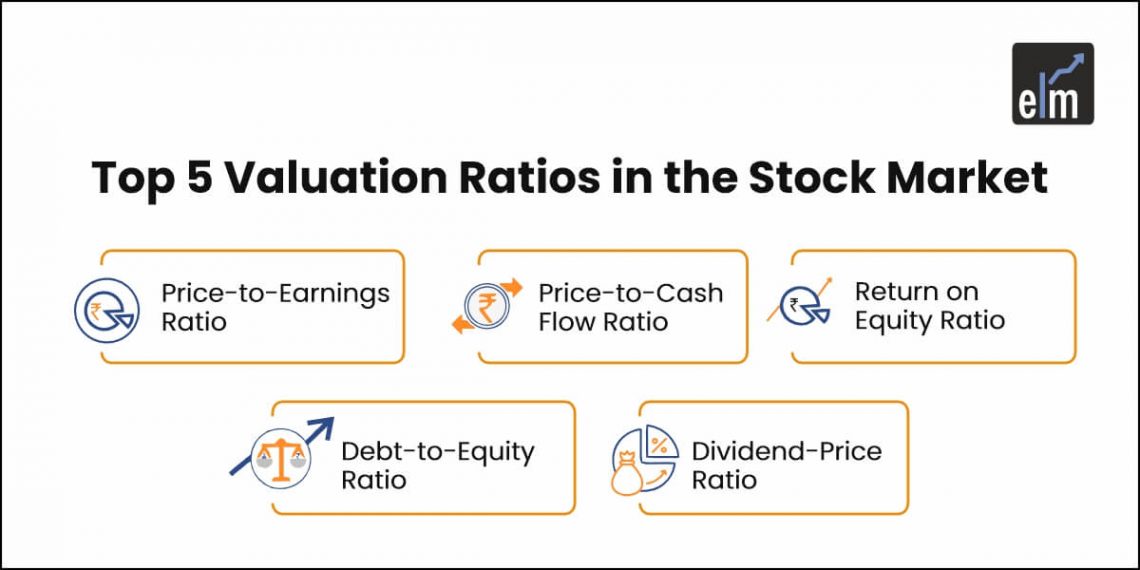
5 Valuation Ratios You Need To Know

Price-to-Earnings Ratio (P/E Ratio)

The Price-to-Earnings (P/E) ratio is one of the most commonly used valuation ratios by investors. It helps you measure a company’s current share price relative to its earnings per share (EPS). It simply answers your question of how much the market willing to pay for every rupee the company earns.

The formula for calculating the P/E ratio is:

P/E Ratio = Market Price per Share/ Earnings per Share (EPS)

Key points to note:

  • Interpretation: ​A high P/E ratio may indicate that investors expect future growth in earnings, while a low P/E ratio could suggest that the stock is undervalued or that the company is experiencing difficulties.
  • Limitations: It does not account for differences in risk or growth rates among companies.

Price-to-Cash Flow Ratio (P/CF Ratio)

The Price-to-Cash Flow (P/CF) ratio evaluates how much investors are willing to pay for each dollar of cash flow generated by the company. This ratio is particularly useful because it focuses on cash generation rather than accounting profits. The formula is:

P/CF Ratio = Market Price per Share/ Cash Flow per Share

A lower P/CF ratio indicates that a stock may be undervalued relative to its cash-generating ability.

Key Points:

  • Interpretation: A lower P/CF ratio is generally more desirable.
  • Usage: Effective for comparing companies with different capital structures.

Return on Equity (RoE) Ratio

Return on Equity (RoE) measures a company’s profitability by comparing net income to shareholders’ equity. It indicates how effectively management is using equity financing to generate profits. The formula for RoE is:

RoE = Net Income/ Shareholders Equity

A higher RoE suggests that a company is efficient at generating profits from its equity base.

Key Points:

  • Interpretation: A sustainable and increasing RoE over time indicates strong management performance.
  • Comparison: Useful for comparing companies within the same industry.

Debt-to-Equity Ratio

The Debt-to-Equity (D/E) ratio assesses a company’s financial leverage by comparing its total liabilities to shareholders’ equity. This ratio helps investors understand how much debt a company is using to finance its operations relative to equity. It answers a simple but important question: is the company relying more on borrowed money (debt) or the money from its owners (equity) to run its business?

The formula is:

Debt to Equity Ratio = Total Liabilities/ Shareholders Equity​

A high D/E ratio may indicate higher financial risk, while a low D/E ratio suggests lower risk and greater financial stability.

Key Points:

  • Interpretation: A high D/E ratio can signal potential financial distress.
  • Usage: Important for assessing risk in capital-intensive industries.

Dividend-Price Ratio

The Dividend-Price (D/P) ratio, also known as the dividend yield, measures the annual dividend payment relative to the stock’s market price. It provides insight into the income generated from an investment in relation to its price. The formula is:

Dividend Price Ratio = Annual Dividends per Share/ Market Price per Share 

This ratio is particularly appealing to income-focused investors looking for regular returns from their investments.

Key Points:

  • Interpretation: A higher D/P ratio indicates better returns for dividend-seeking investors.
  • Consideration: Should be analysed alongside payout ratios and company growth prospects.

Which Valuation Ratio is Right For You?

Choosing the right valuation ratio depends on your investment strategy and goals:

If you are focused on growth stocks, consider utilising the P/E ratio and ROE to gauge future potential.

For income-focused investments, prioritise the Dividend-Price ratio to assess yield.

Additionally, If you are concerned about your financial stability and risk, look closely at the Debt-to-Equity ratio alongside cash flow metrics like the P/CF ratio.

Understanding these nuances will enhance your ability to conduct thorough fundamental analysis of stocks and make informed decisions in the share market.

However, mastering fundamental analysis can feel overwhelming for beginners. This is where the experts at Elearnmarkets step in to bridge the gap. Our Stock Market Fundamental Analysis Course is specifically designed to help learners develop a deep understanding of these critical ratios and how to apply them effectively.

Conclusion

Valuation ratios serve as indispensable tools if you’re looking to assess stock value effectively. By understanding and applying these top five valuation ratios, you can gain valuable insights into a company’s financial health and make more informed investment decisions. As you learn fundamental analysis of stocks through courses or self-study, integrating these valuation ratios into your evaluation process will empower you as an investor.

You can use Fundamental Scans to pick stocks for investment

Frequently Asked Questions (FAQ)

1. What is the ratio method of valuation?

The ratio method of valuation involves using various financial ratios to assess a company’s value relative to its earnings, cash flow, or other metrics. This method helps investors determine if a stock is overvalued or undervalued based on historical or projected performance.

2. How to calculate valuation ratios?

Valuation ratios are calculated using specific formulas that relate stock price to earnings, cash flow, equity, or dividends. For example:

P/E Ratio: Market Price per Share/EPS

P/CF Ratio: Market Price per Share/ Cash Flow per Share​

Each ratio has its own unique calculation method based on relevant financial data.

3. How to calculate company value?

To calculate a company’s value using valuation ratios:

  • Select appropriate ratios based on your analysis focus (for example: earnings-based or cash flow-based).
  • Gather necessary financial data from the company’s financial statements.
  • Apply the formulas for each selected valuation ratio.
  • Compare these ratios against industry benchmarks or historical data to assess value accurately.
Tags: fundamental analysisvaluation Ratios
ShareTweetSend
Get Kotak Offer Get Kotak Offer Get Kotak Offer
Previous Post

How to Do Trading with Trendlines?

Next Post

Trend Trading: Strategies and Techniques You Need to Know

Vivek Bajaj

Vivek Bajaj

Mr. Vivek Bajaj has over 18 years of trading experience in equities, options, currencies, and commodity markets. He is the co-founder of Stockedge and Elearnmarkets and is passionate about data, analytics, and technology. He serves on various exchange committees and has played a significant role in the evolution of India's derivative market. He has been a speaker at various colleges and higher institutions, including IIT and IIMs.

Related Posts

price to sales ratio
Fundamental Analysis

Price to Sales Ratio: A Key Metric for Understanding Company Value

May 5, 2025
438
Gearing Ratio
Fundamental Analysis

What Is the Gearing Ratio? Formula & Calculation

December 3, 2024
1.1k
Top 5 Fundamental Analysis Tools 2
Fundamental Analysis

Top 5 Fundamental Analysis Tools

January 31, 2025
4.1k
Business Models - Example, Types, Importance & Advantages 3
Fundamental Analysis

Business Models – Example, Types, Importance & Advantages

May 14, 2024
185.9k

Leave a Reply Cancel reply

Your email address will not be published. Required fields are marked *

Disclaimer

Elearnmarkets (Kredent InfoEdge Pvt. Ltd.) is a SEBI-registered Research Analyst (RA) entity (SEBI Registration No.: INH300007493). The information provided in this article is for educational and informational purposes only and should not be considered as an offer to buy or sell any securities or investment products.

The stocks, securities, and investment instruments mentioned herein are not recommendations under SEBI (Research Analysts) Regulations, 2014. Readers are advised to conduct their own due diligence and seek independent financial advice before making any investment decisions.

Investments in securities markets are subject to market risks. Please read all related documents carefully before investing. Investing in Equity Shares,
Derivatives, Mutual Funds, or other instruments carry inherent risks, including potential loss of capital. Elearnmarkets (Kredent InfoEdge Pvt. Ltd.) does not provide any guarantee or assurance of returns on any investments. Past performance is not indicative of future performance.

Elearnmarkets Logo

Follow Us

Facebook-f X-twitter Instagram Linkedin-in Youtube Telegram

Register on Elearnmarkets

Continue your financial learning by creating your own account on Elearnmarkets.com

Register Free Account

Download App

Playstore logo
Download on app store

Categories

  • Basic Finance
  • Derivatives
  • Financial Planning
  • Fundamental Analysis
  • Technical Analysis
  • Mutual Funds
  • Miscellaneous

Popular On Elearnmarkets

  • Market Superheroes:
  • Vivek Bajaj
  • Chetan Panchamia
  • Ashish Kyal
  • Premal Parekh
  • Abhijit Paul
  • Jegan
  • Sivakumar Jayachadran
  • Jyoti Budhia
  • Vivek Gadodia
  • Vishal Mehta
  • Piyush Chaudhry
  • Santosh Pasi
  • Gomathi Shankar
  • Market Superheroes:
  • Vivek Bajaj
  • Chetan Panchamia
  • Ashish Kyal
  • Premal Parekh
  • Abhijit Paul
  • Jegan
  • Sivakumar Jayachadran
  • Jyoti Budhia
  • Vivek Gadodia
  • Vishal Mehta
  • Piyush Chaudhry
  • Santosh Pasi
  • Gomathi Shankar
  • Courses:​
  • Options Trading
  • Dow Theory
  • Momentum Trading
  • Stock Investing
  • Harmonic Chart Patterns
  • Algo Trading
  • Elliot Wave Theory
  • Advanced Excel
  • Cryptocurrency
  • NSE Certification Course
  • Courses:​
  • Options Trading
  • Dow Theory
  • Momentum Trading
  • Stock Investing
  • Harmonic Chart Patterns
  • Algo Trading
  • Elliot Wave Theory
  • Advanced Excel
  • Cryptocurrency
  • NSE Certification Course
  • Webinars:
  • Bank Nifty Scalping
  • Intraday Trading Strategies
  • Options Trading Strategies
  • Options selling
  • Price Action
  • Relative Strength
  • Tax Planning
  • Options Buying
  • Growth Stocks
  • Portfolio Management
  • Risk Management
  • Renko Charts
  • Crude Oil
  • Traders Psychology
  • Moving Average
  • Multibagger Stocks
  • Free Learning Modules:
  • Intraday Trading
  • Options Scalping
  • Swing Trading
  • Financial Modelling
  • RSI Indicator
  • Bollinger Bands
  • Pricing of Futures
  • Personal Finance
  • Initial Public Offerings (IPO)
  • Value Investing
  • Technical Indicators
  • Candlesticks
  • Chart Patterns
  • Option Greeks
  • ELSS Funds
  • Banking and Insurance
  • Real Estate
  • Gold
  • Book Summaries:
  • Rich Dad Poor Dad
  • Psychology of Money
  • The Intelligent Investor
  • The Richest Man in Babylon
  • Think and Trade Like a Champion
  • Value Investing and Behavioural Finance
  • Trading in the Zone
  • Learn to Earn
  • Book Summaries:
  • Rich Dad Poor Dad
  • Psychology of Money
  • The Intelligent Investor
  • The Richest Man in Babylon
  • Think and Trade Like a Champion
  • Value Investing and Behavioural Finance
  • Trading in the Zone
  • Learn to Earn
  • Tools:
  • CAGR Calculator
  • SIP Calculator
  • eLearnOptions
  • Future Value Calculator
  • Present Value Calculator
  • Atal Pension Yojana
  • Cost of Delay Calculator
  • Become a Crorepati
  • Tools:
  • CAGR Calculator
  • SIP Calculator
  • eLearnOptions
  • Future Value Calculator
  • Present Value Calculator
  • Atal Pension Yojana
  • Cost of Delay Calculator
  • Become a Crorepati

© 2025 Elearnmarkets. All Rights Reserved

  • Visit Elearnmarkets
  • Courses
  • Webinars
  • Financial Guides
  • Get Free Counselling
  • Visit Elearnmarkets
  • Courses
  • Webinars
  • Financial Guides
  • Get Free Counselling

Download Our App

No Result
View All Result
  • Article Categories
    • Basic Finance
    • Derivatives
    • Financial Planning
    • Fundamental Analysis
    • Technical Analysis
    • ETFs & Mutual Funds
    • Marketshala
    • Miscellaneous
  • Language
    • Hindi
    • Bengali
    • English
  • Courses
  • Webinars
  • Stories
Get Free Course

© 2024 Elearnmarkets All Rights Reserved

Infinity Plan
Trading Day 2025