Triple candlestick patterns are powerful technical analysis tools that help traders identify potential trend reversals. These formations consist of three consecutive candles that signal when momentum is shifting and a new price direction may be emerging. The two primary patterns – Three Inside Up and Three Inside Down – provide early warnings of bullish and bearish reversals, respectively.
Three Inside Up Pattern (Bullish Reversal)
What It Signals:
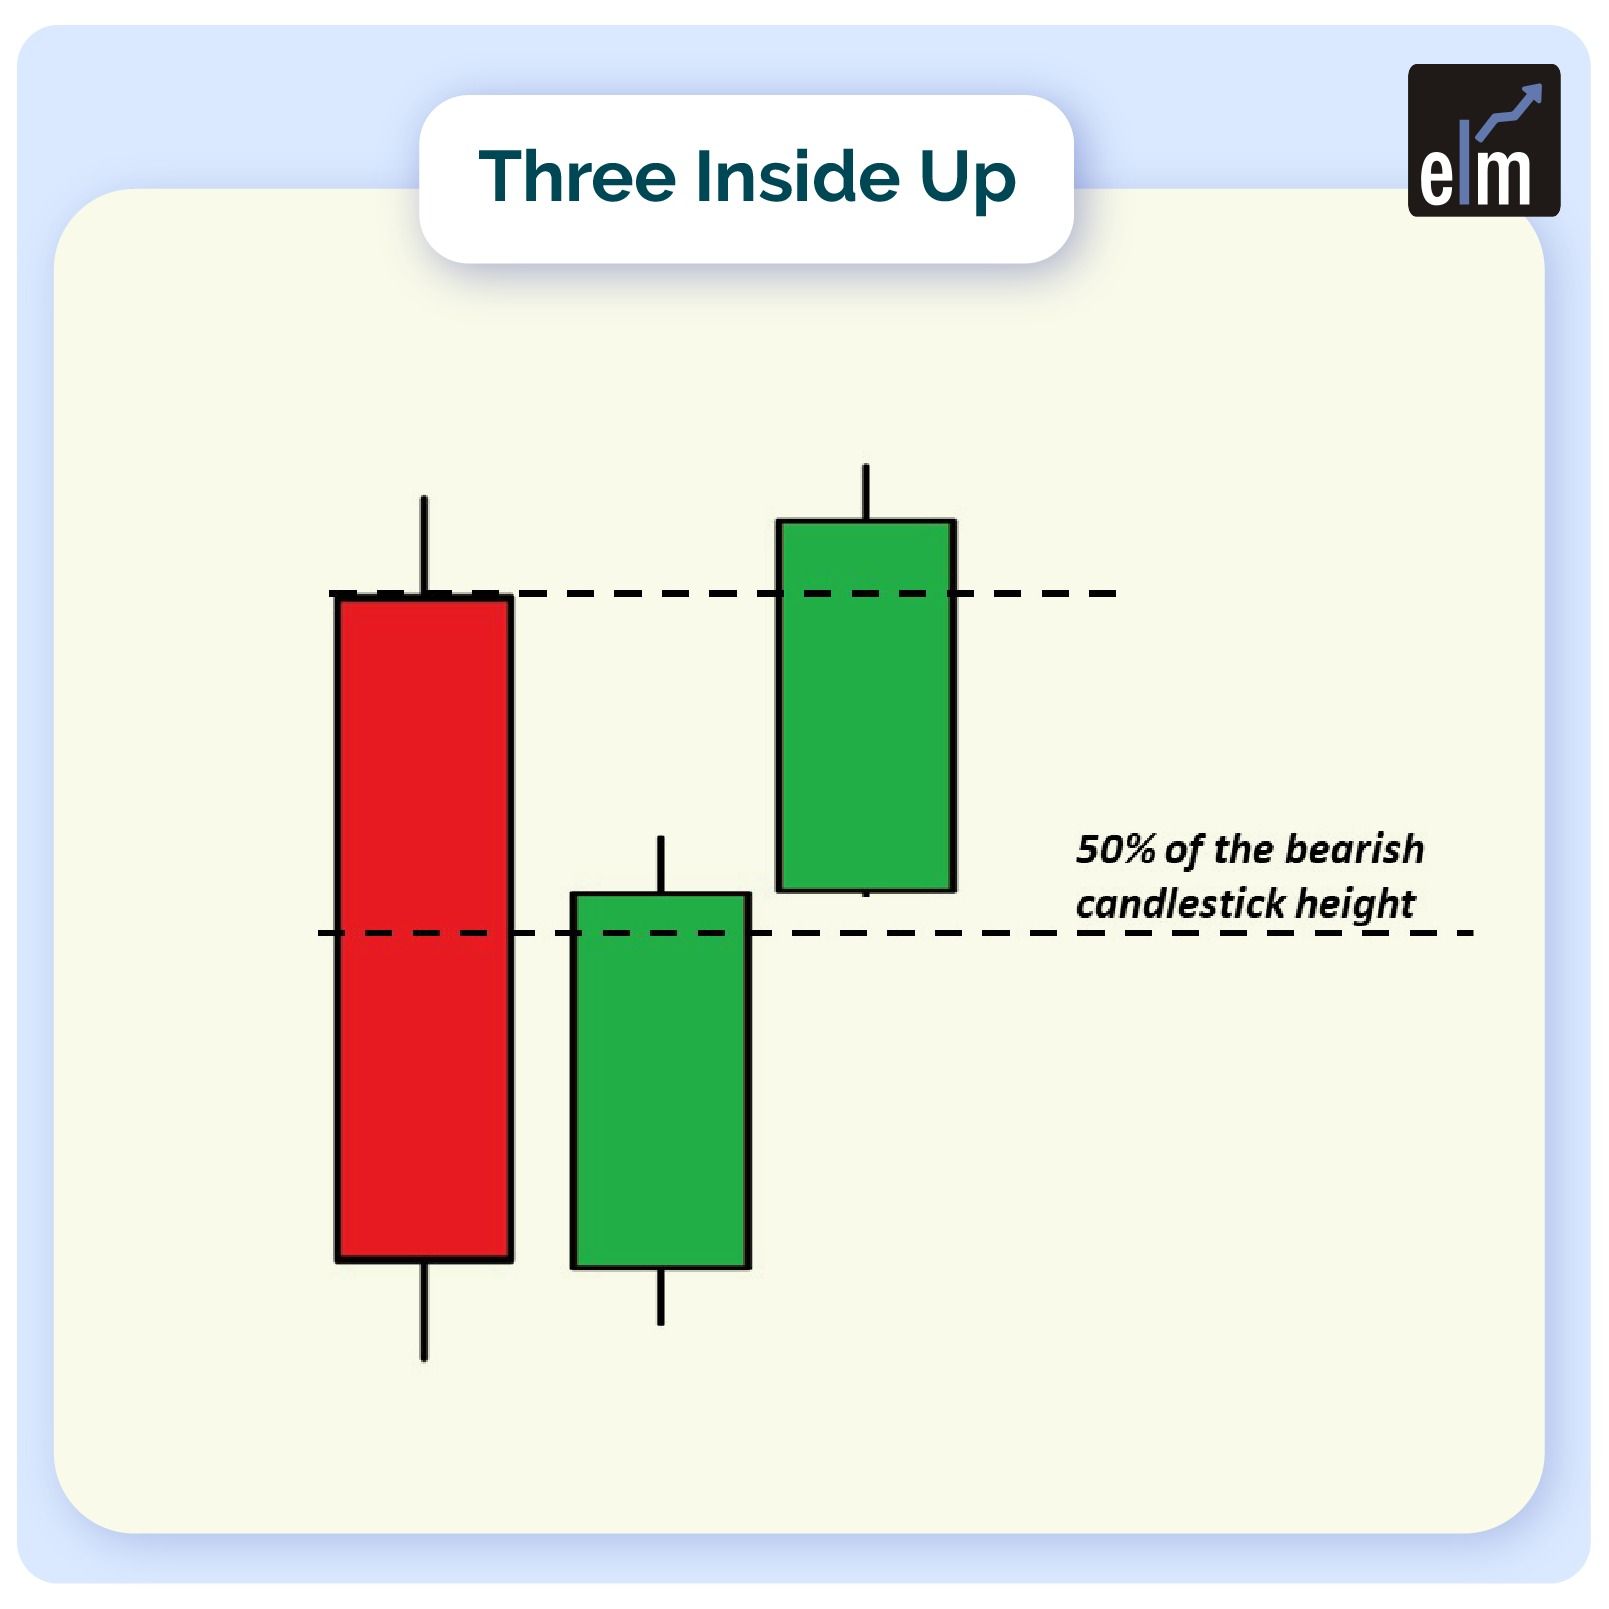
The Three Inside Up pattern emerges during a downtrend and suggests that selling pressure is weakening while buyers are beginning to gain control. It indicates a potential shift from bearish to bullish momentum.
Pattern Structure:
The pattern develops through three distinct candles:
First Candle: A long bearish (red/black) candle that continues the existing downtrend with strong selling pressure.
Second Candle: A smaller bullish (green/white) candle that opens and closes entirely within the body of the first candle, showing initial hesitation among sellers.
Third Candle: A bullish candle that closes above the high of the second candle, confirming buyer strength and the reversal.
Market Psychology:
The Three Inside Up pattern reveals a psychological shift in three stages. The first candle shows sellers dominating with confidence, pushing prices to new lows. The second candle introduces doubt, the price gaps or opens within the previous range but closes higher, trapping short sellers who expected further decline. The third candle validates the reversal as buyers overwhelm remaining sellers, often prompting short covering and attracting new long positions.
Trading Strategy
Traders typically wait for the third candle to confirm before entering positions. Entry can occur near the close of the third candle or on the next trading session’s open. Stop-loss placement varies based on risk tolerance, commonly positioned below the low of any of the three candles. Conservative traders may wait for additional confirmation through volume increase or support from other technical indicators.
Three Inside Down Pattern (Bearish Reversal)
What It Signals
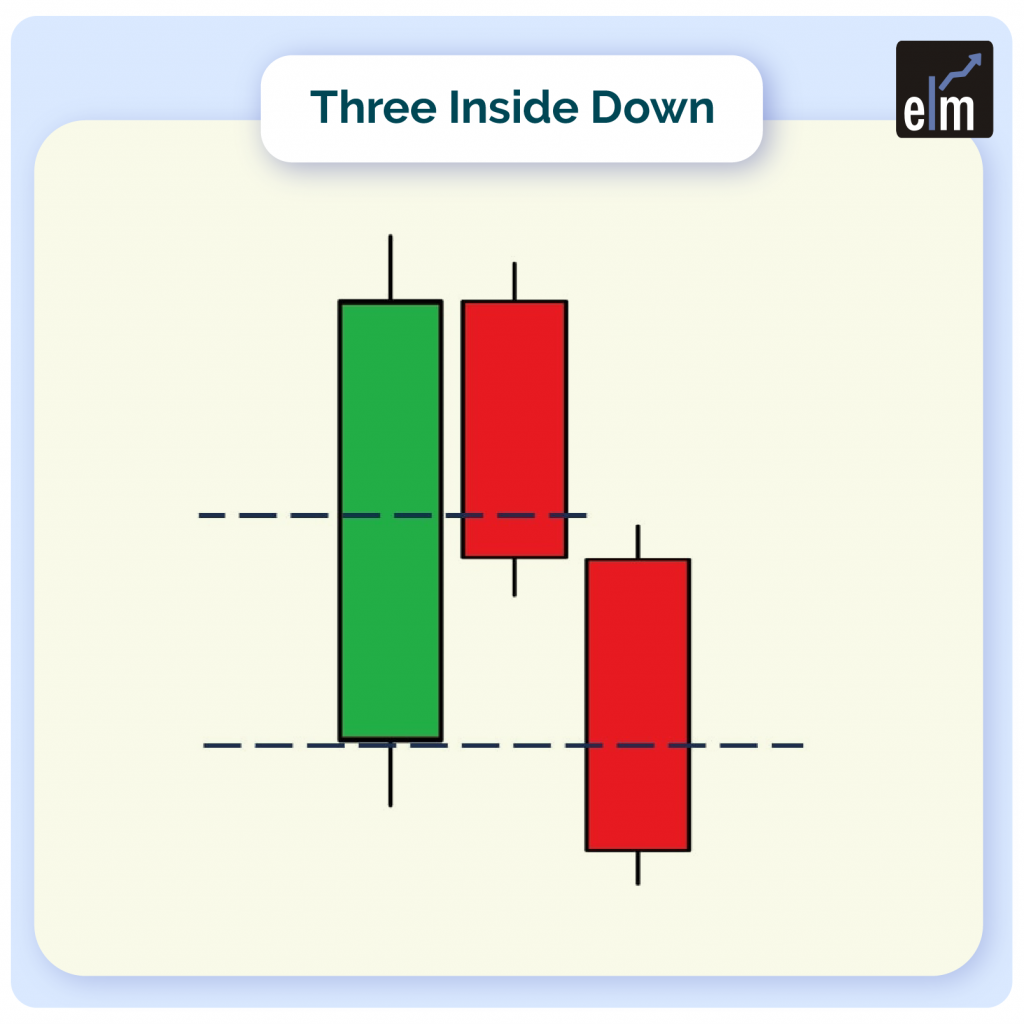
The Three Inside Down pattern appears during an uptrend and warns that buying momentum is fading while sellers are gathering strength. It forecasts a potential reversal from bullish to bearish price action.
Pattern Structure
The three-candle sequence unfolds as follows:
First Candle: A long bullish candle continuing the uptrend with strong buying pressure and optimistic sentiment.
Second Candle: A smaller bearish candle that opens with a gap down and closes within the body of the first candle, resembling a bearish harami and signaling uncertainty.
Third Candle: A bearish candle that closes below both the second candle and ideally below the first candle’s close, confirming seller dominance.
Market Psychology
The first candle reflects bullish confidence with buyers in full control. The surprise gap-down opening of the second candle shakes this confidence. Bulls become cautious while bears make their first aggressive move. By the third candle, selling pressure intensifies as buying demand evaporates, confirming that bears have seized control and the uptrend has reversed.
Trading Confirmation
For the pattern to be valid, the third candle must close below the second candle’s low. Stronger signals occur when it also closes below the first candle’s body. Traders look for this decisive move to confirm the reversal before taking short positions or exiting long positions.
Key Considerations
Context Matters: These patterns are most reliable when they appear after established trends. Three Inside Up following a clear downtrend and Three Inside Down after a sustained uptrend.
Volume Confirmation: Increased trading volume on the third candle strengthens the reversal signal and suggests genuine momentum shift rather than a false breakout.
Combine with Other Indicators: While powerful alone, Three Inside Up and Three Inside Down patterns work best when confirmed by additional technical tools such as RSI, MACD, support/resistance levels, or trendline breaks.
Not All Patterns Work: Markets are complex, and reversal patterns can fail. Always use proper risk management and avoid over-reliance on any single indicator.
Time Frame Flexibility: These patterns appear across all time frames but tend to be more reliable on daily and weekly charts where there’s sufficient market participation.

Practical Application Tips
- Wait for Completion: Never assume the pattern before all three candles have formed
- Assess the Trend: Ensure there’s an actual trend to reverse—these patterns are less effective in sideways markets
- Risk-Reward Ratio: Target profit zones that offer at least a 2:1 or 3:1 risk-reward ratio
- Market Environment: Consider broader market conditions and news events that might influence price movement
- Practice Recognition: Study historical charts to train your eye for identifying these formations quickly
Final Thoughts
The Three Inside Up and Three Inside Down patterns are valuable additions to any trader’s technical analysis toolkit. They provide early identification of potential reversals by capturing the transition of market control between bulls and bears. However, like all technical patterns, they should be used as part of a comprehensive trading strategy that includes risk management, multiple confirmation signals, and an understanding of overall market context. Success comes not from pattern recognition alone but from disciplined execution and proper integration with other analytical methods.
Read More- All 35 Candlestick Chart Patterns in the Stock Market
Frequently Asked Questions (FAQs)
1. What is the difference between Three Inside Up/Down and other reversal patterns?
The Three Inside Up and Down patterns are unique because they combine elements of other patterns. The first two candles resemble a harami pattern (a smaller candle within a larger one), while the third candle provides confirmation. Unlike two-candle patterns like engulfing or harami, the three-candle structure offers more confirmation and reliability by showing a clear progression from the old trend through hesitation to the new trend.
2. What is a 3 Top Candle Pattern?
Technical analysts utilize chart patterns like the triple top to forecast when the price of an asset will reverse course. A triple top, which consists of three peaks, suggests that the asset might not be rallying any longer and that lower prices might be approaching.
3. How can I identify a valid Three Inside Down pattern?
A valid Three Inside Down pattern appears after an uptrend and includes three specific candles: First, a long bullish candle continuing the upward movement. Second, a smaller bearish candle that opens with a gap down and closes within the first candle’s body. Third, a bearish candle that closes below the second candle and preferably below the first candle as well. The key validation point is that the third candle must decisively break downward, confirming the bearish reversal.


