Hindi: आप इस लेख को हिंदी में भी पढ़ सकते है|
When we look at a certain stock for trading, there are certain parameters we look at before we start investing in that stock such as technical parameters, fundamental parameters, futures and options parameters. One of the most important future parameters is open interest.
When we talk about ‘open interest’ in the context of the futures market, it is basically the total number of open contracts in the futures segment. In this article, we will discuss the role of it in the futures market.
Table of Contents
What is Open Interest (OI)?
In the futures market, there is a buyer and seller and together they make up one contract. Open Interest is defined by the number of open contracts in the market.
The OI changes in this whether an increase or decrease in the number of contracts in each stock is recorded both during the live market and at the end of the day. This is shown by the positive or negative change.
We can see the data at the end of the day on the StockEdge website.

This screen tells us the change in OI as of 8TH August 2023. We can see that the strike prices are listed in ascending order from the most increase in the OI to the most decrease.
We can see that high OI addition in the stock- Reliance Industries Ltd. When the OI increases with the increase in the price of that particular stock then it is said that OI is confirming the uptrend. Similarly when the OI increases with the decrease in the price of that particular stock then it is said it is confirming the downtrend.
Role of Open Interest in the Futures Market
The main role of open interest in the futures market is to determine whether the market is getting weaker or stronger. Let us discuss how:-
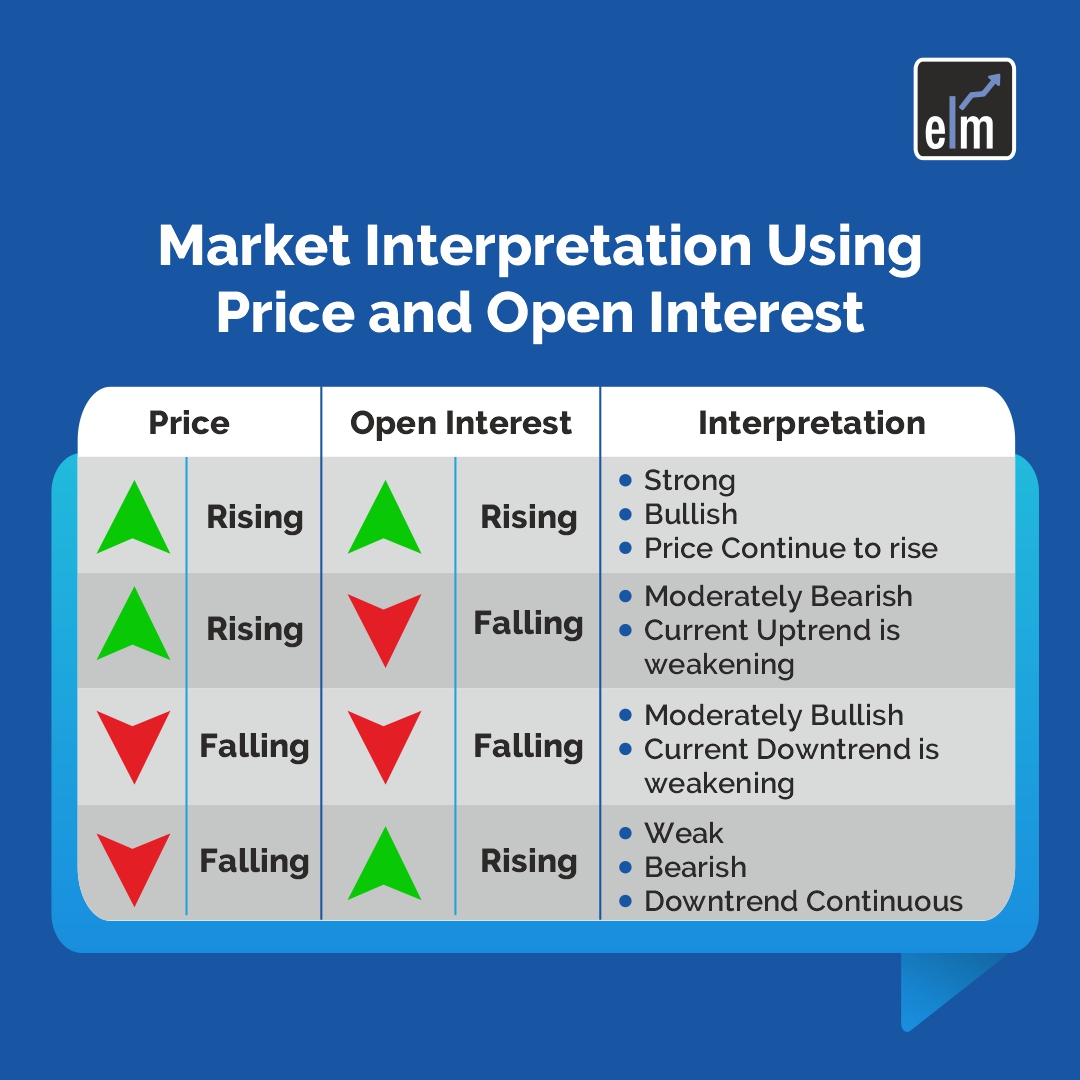
Here we can see that if the price increases with an increase in the OI then it is a bullish signal as more buyers are entering the market and purchases are being made aggressively.
An increase in the price with the decrease in the OI can be taken as a bearish signal. This market condition takes place as there is a short covering in the market. This situation arises when the money is flowing out of the market.
After the short covering, the prices will eventually decline. If the prices decrease with the increase in the OI then this indicates that new short positions are taking place. A decline in both price and OI gives a bearish signal.
Example

From the image above we can see that the OI in Cipla Ltd. has increased from 3rd August.
We can see that there was an increase in the volume on 3rd August. This could have been taken as a bullish signal in Cipla Ltd.
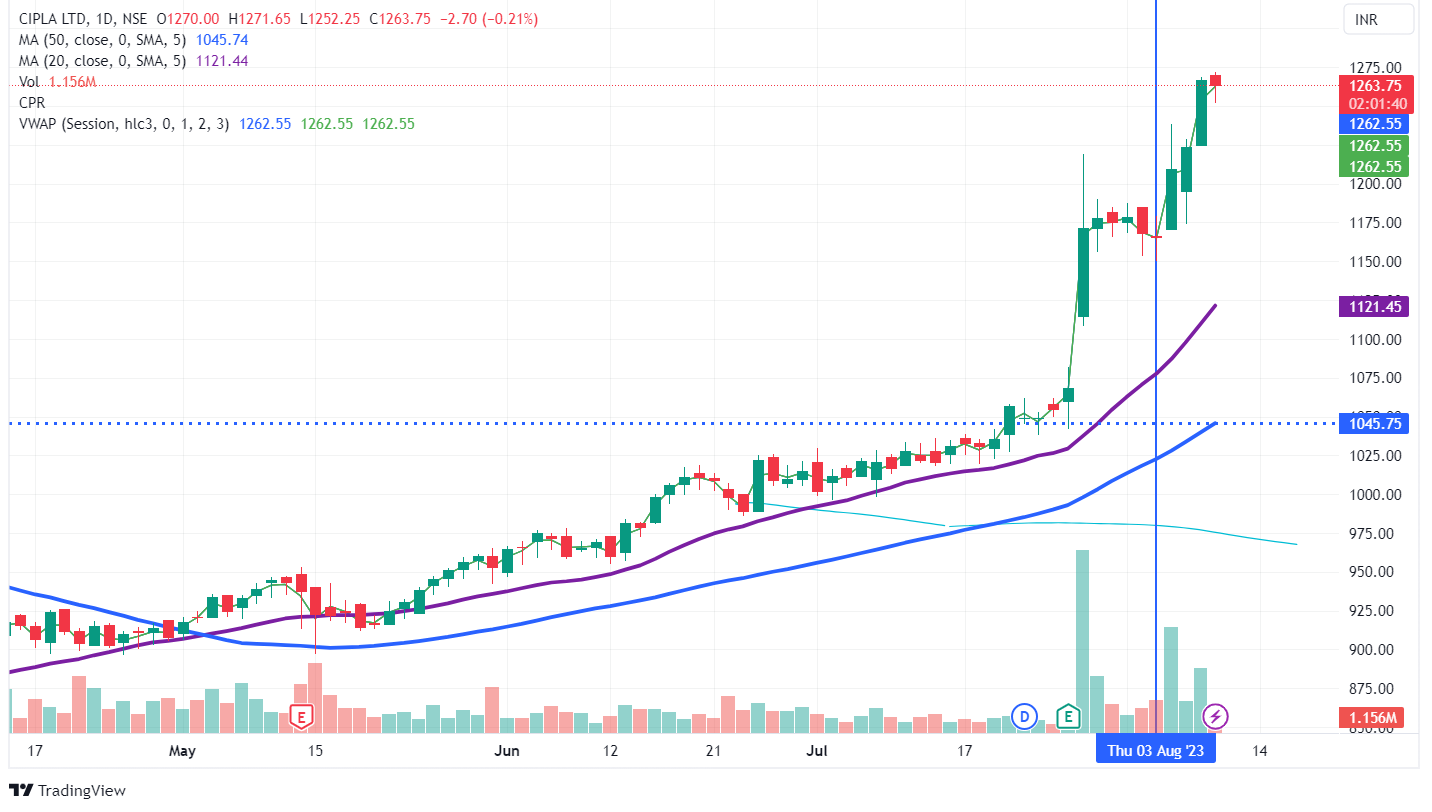
As we can see in the Daily chart of Cipla Ltd. that it is already in an uptrend, with the increase in volume, OI and price we can interpret that Cipla Ltd. could stay bullish. Also, from the below image we can see that other technical indicators also giving bullish signals.
Open Interest Analysis Using StockEdge
We can also do this Open Interest analysis using StockEdge. There are open interest scans present in StockEdge. It has scans like open interest scans, long position scans, and short position scans. In the OI scans, we can see the companies in which there is a high increase or decrease in OI. It automatically gives us the list of the companies with high or low OI.

Below is the list of stocks having the highest increase in call open interest as shown below:

Dive into the essentials of futures markets and elevate your trading skills with our Future and Option Trading Course!
Bottom Line
As discussed, the Open Interest helps traders in the futures market to get a sense of whether the market is getting weaker or stronger. This is the main role of open interest in the futures market. We should not fall into the trap of just analyzing the number of open interests in the future market but we should analyze it with respect to prices and volume. This is the most common mistake the traders do while analyzing the open interest.






I like this website very much, Its a real nice billet to read and receive information.