
A moving average is one of the lagging technical indicators which the traders and investors use for determining the trend’s direction.
It totals the data points of any financial security and then divides the total by the number of data points over a specific time period for arriving at an average.
It is referred to as the “moving” average as it is continually recalculated which is based on the latest price data.
The moving average is used by an analyst for determining support and resistance by evaluating the asset’s price movements.
This indicator shows the previous price movement of a security which the traders use to determine the potential direction of the asset price.
It is a lagging indicator as it trails the price action of any underlying asset for producing a signal or to show the price direction of any stock.
- What are Moving Averages?
- How do Moving Averages Work?
- Types of Moving Averages
- 1. Simple MA Indicator-
- 2. Exponential MA Indicator (EMA)-
- 3. Weighted MA Indicator (WMA)-
- 4. Double Exponential MA Indicator (DEMA)-
- 5. The Triple Exponential MA Indicator (TEMA)-
- 6. Linear Regression (or) Least square Moving Averages Indicator-
- Frequently Asked Questions (FAQs)
- Bottomline
Below are 6 Types of Moving Averages that traders use when trading in the stock market:
What are Moving Averages?
A series of averages of various subsets of the entire dataset are computed to analyze data points using a MA technique. It works especially well for highlighting longer-term patterns and mitigating short-term swings.
How do Moving Averages Work?
Select between an exponential moving average (EMA) and a simple moving average (SMA). While EMA gives more weight to recent data points, making it more sensitive to recent price fluctuations, SMA computes the average of data points evenly across a given period.
Types of Moving Averages
Here are the types of moving averages-
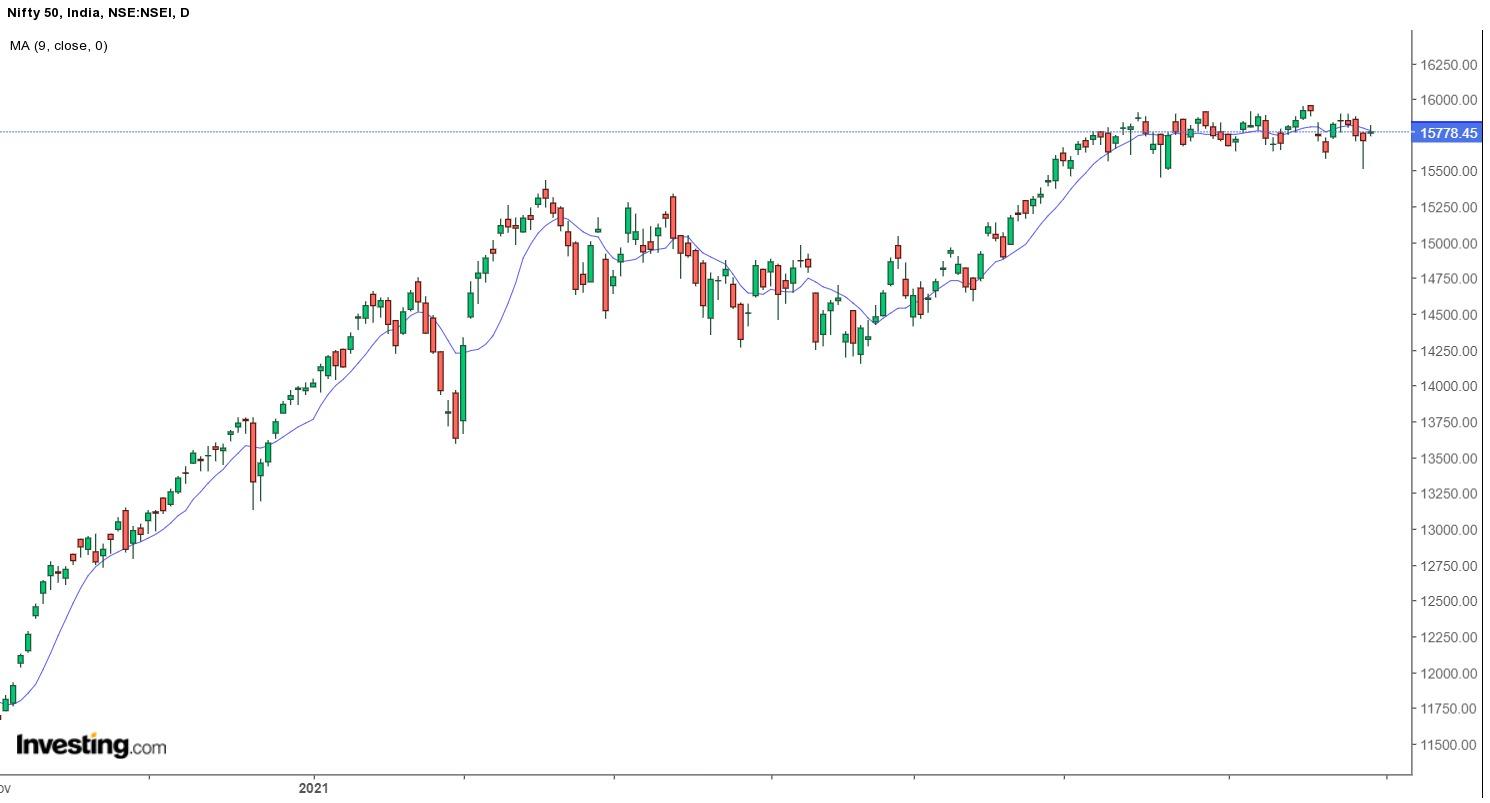
1. Simple MA Indicator-
The SMA Is the simplest moving average that is obtained by adding the most recent data points set and then dividing the total by the number of time periods.
The SMA indicator is used for traders to generate signals of when to enter or exit the stock.
An SMA is a lagging indicator as it is based on the past price data for a given period that can be computed for different types of prices such as high, low, open, and close.
Traders use this indicator for determining buy, sell signals for securities and also helps to identify support and resistance zones.
For example, a stock trader wants to calculate the simple moving average for a stock by taking its closing price for the last five days.
The closing prices for the last five days are as follows: Rs.23, Rs.23.40, Rs.23.20, Rs.24, and Rs.25.50. The SMA is then calculated as follows:
SMA = (Rs.23 + Rs.23.40 + Rs.23.20 + Rs.24 + Rs.25.50) / 5
SMA = Rs.23.82
The SMA of the last 9 periods of Nifty 50 is plotted as a line on the price charts as shown below:
2. Exponential MA Indicator (EMA)–
EMA is the other type of moving average that gives more weight to the most recent price points and makes it more responsive to recent data points.
EMA is more responsive to recent price change when compared to the SMA as it applies the same weight to all price changes in the given specific period.
There are three steps involved when calculating EMA:
- First, we need to calculate the simple moving average for the specific period.
- Then we need to calculate the multiplier for weighing the exponential moving average.
- The last step involves the calculation of the current EMA by taking the period from the initial EMA until the most recent time period, using the price, multiplier, and the previous period’s EMA value. The formula is:
Current EMA = [Closing Price – EMA (Previous Time Period)] x Multiplier + EMA (Previous Time Period)
The Exponential Moving Average indicator of the last 9 periods of Nifty 50 is plotted as a line on the price charts as shown below:
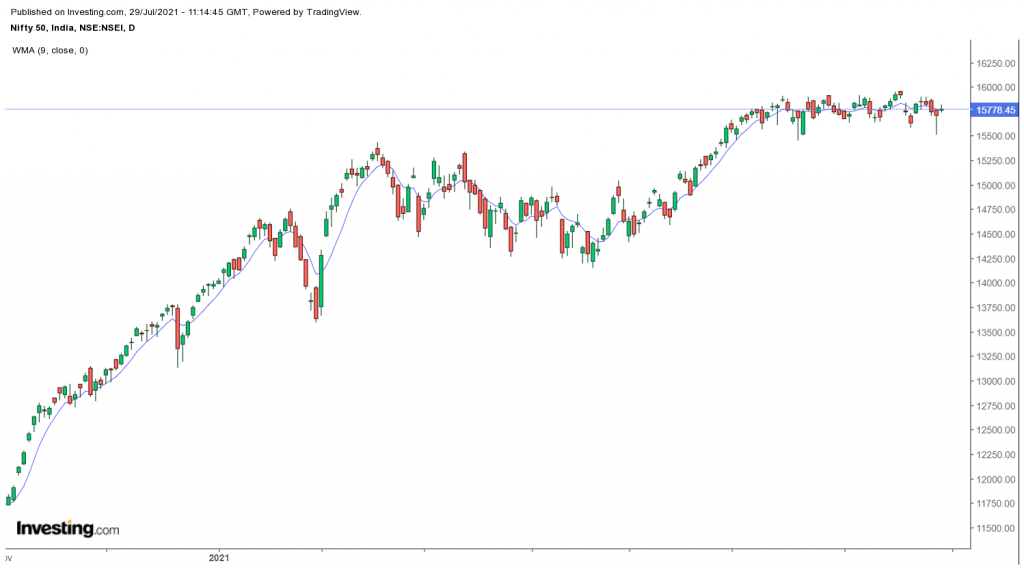
3. Weighted MA Indicator (WMA)–
WMA is another type of moving average which traders use for generating trade direction and making a buy or sell decision.
It gives greater weightage to the recent data points and less weightage on past data points.
It is calculated by multiplying each point in the data set by a weighting factor.
Traders use the weighted average for generating trade signals. For example, when the prices are above the weighted moving average, then it signals that the trend is an uptrend.
But if the prices are below the weighted moving, then it indicates the trend is down.
The WMA of the last 9 periods of Nifty 50 is plotted as a line on the price charts as shown below:


4. Double Exponential MA Indicator (DEMA)-
DEMA is an improved version of EMA as it allocates more weight to the most recent data points.
It reduces lag results and is more responsive that helps short-term traders in spotting trend reversals quickly.
Let us look at Nifty 50 prices over 9 days:
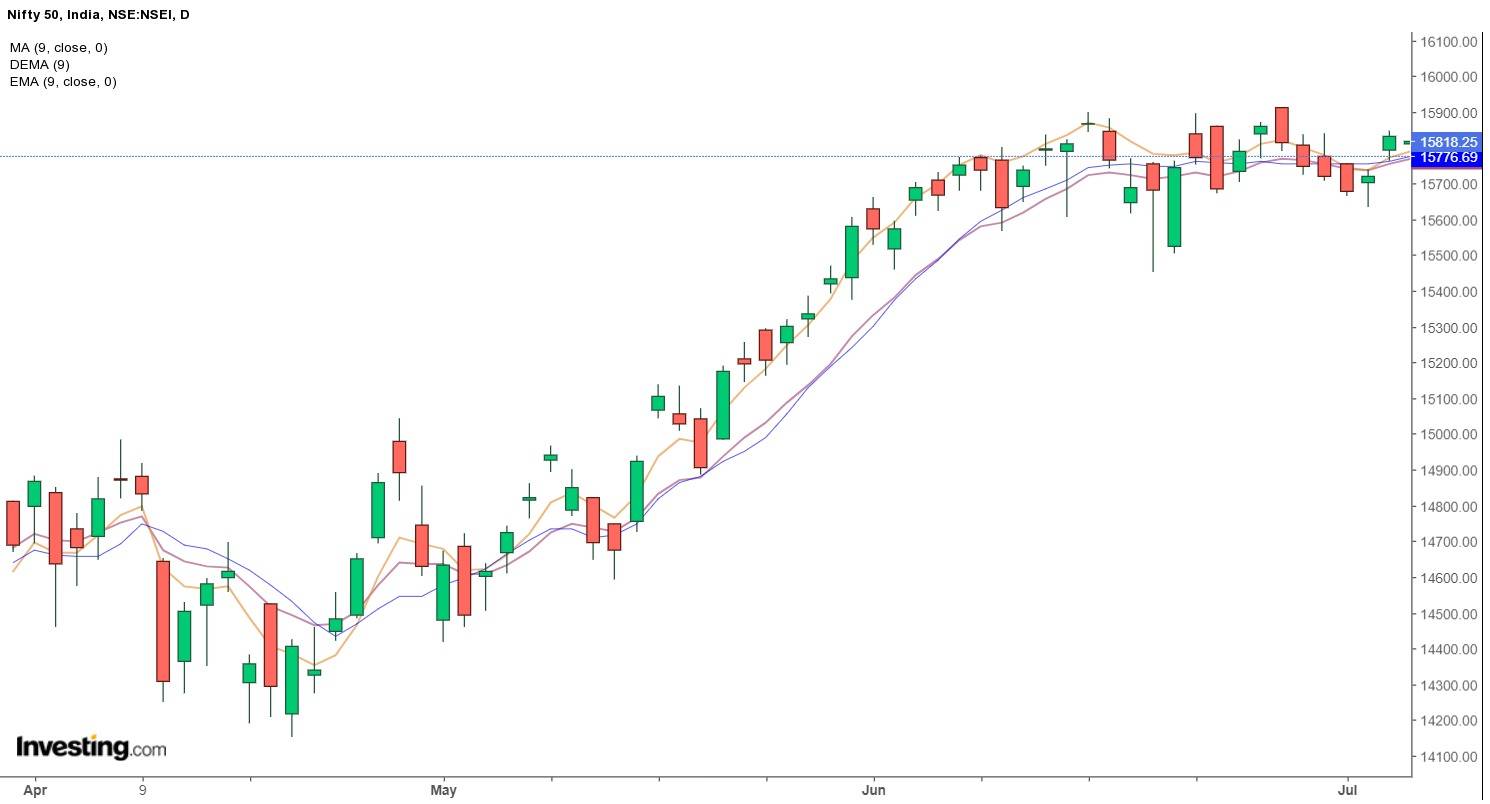
The blue line indicates a simple moving average line, the purple line indicates exponential moving average (EMA), and the yellow line is the DEMA line.
From the above chart, we can say that the DEMA is closest to the price points and with the least deviations.
Since the DEMA line mimics the stock prices most closely, it is, therefore, most sensitive to the stock volatility. Changes in volatility are good indicators for a trend reversal, and hence, stock trades.
Watch our Webinar on the Magic of Moving Averages
5. The Triple Exponential MA Indicator (TEMA)–
TEMA reduces the lag of EMAs and makes them more responsive to the prices.
After the Double Exponential Moving Average (DEMA) was developed in 1994, Patrick Mulloy created the Triple Exponential Moving Average (TEMA).
Just like DEMA, the TEMA reduces the lag difference between different EMA.
The difference between DEMA and TEMA is that TEMA’s formula uses a triple-smoothed EMA in addition to the single and double-smoothed EMAs employed in the formula for DEMA.
In the chart below, TEMA is shown as the yellow line and DEMA is shown as the purple line:
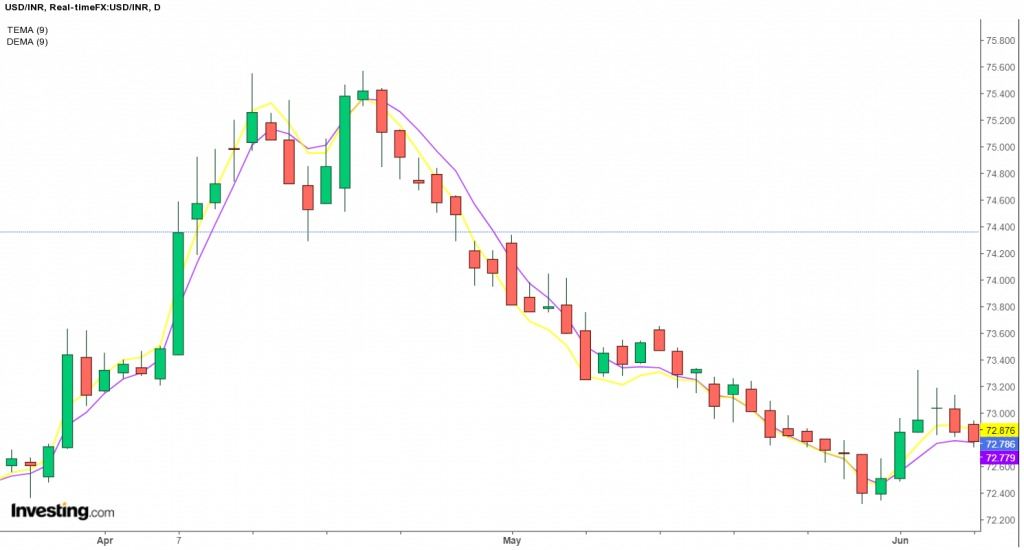
Thus, this indicator created using these three EMAs produces a moving average that stays even closer to the price bars than DEMA.
6. Linear Regression (or) Least square Moving Averages Indicator-
The least-square moving average (LSMA) calculates the least-squares regression line for the preceding time periods; thus, it leads to forward projections from the current period.
The indicator helps in identifying what could happen if the regression line is continued.
The indicator is based on the sum of least squares method for finding a straight line that best fits data for the particular period.
You can also watch the video below to understand the concept of this technical indicator below:
Frequently Asked Questions (FAQs)
Which moving average is best for intraday?
Because of its ability to react quickly to recent changes in price, the EMA is frequently chosen for intraday trading.
Which is the fastest moving average?
Because of its quick response to recent price fluctuations, the exponential moving average (EMA) is the fastest moving average.
What is the 9 EMA strategy?
The 9 EMA strategy uses the 9-period Exponential MA to identify short-term trends and potential entry or exit points.
Which is better EMA or SMA?
SMA is more straightforward and smoother for longer trends, but EMA is frequently chosen for its responsiveness to current market movements.
Bottomline
Moving Average is mainly used for identifying the trend of any financial securities rather than giving trading signals as it is a lagging indicator. As with the other technical indicators, moving averages should also be used with other technical tools like price action or momentum indicators.
Happy Investing!


Very good education
Hi,
We really appreciated that you liked our blog.
For more detailed learning on Moving Averages, you can read Magic of Moving Average from ELM School.
Keep Reading!
Great blogs
Hi,
We really appreciated that you liked our blog.
For more detailed learning on Moving Averages, you can read Magic of Moving Average from ELM School.
Keep Reading!
The articles on various topics such as Moving Averages etc.are very informative and contextual. I prefer to use these blogs as a traders dictionary on concept development and trading improvement hand hold. Also it helps beginners get clarity in their though process while trading while at the same time refreshes trading usage and concepts for regular traders.
Hi,
We really appreciated that you liked our blog.
For more detailed learning on Moving Averages, you can read Magic of Moving Average from ELM School.
Keep Reading!
Nicely explained
Hi,
We really appreciated that you liked our blog.
For more detailed learning on Moving Averages, you can read Magic of Moving Average from ELM School.
Keep Reading!
Very nice, but also giving more details. Thanks🙏
Hi,
We really appreciated that you liked our blog.
Keep Reading!