
While applying Technical Analysis using various chart trends, drawing conclusions that might be profitable in the short term trades, every investor should have a clear idea about the bigger picture that can influence a company’s valuation.
To have a holistic view of the securities that an investor wants to invest in, a combination of both Fundamental and Technical Analysis is deemed to be the most effective tool to predict the price movements in both the short term and long term.
What is Fundamental Analysis of stocks?
Fundamental Analysis of stocks refers to the method of analyzing the economic and financial factors in the market to measure the intrinsic value of a security.
Fundamental Analysis techniques believes that any macroeconomic factors like the state of the economy, inflation, any fiscal or monetary policy taken up by the government might have an effect on the securities in the market.
Usually, Fundamental Analysis techniques are applied from a macro level first, where factors that dictate and affect the state of the economy are being analyzed.
Then, the analysts move on to the micro-level, where the analysts focus on the growth of a specific industry and look at company-specific factors like composition of Management, structural changes in management, etc.
Finally, the analyst concludes by calculating whether the security is currently overvalued or undervalued, as compared to its present value, and trade calls are made accordingly.
Components of Fundamental Analysis
The scope of Fundamental Analysis is vast and it covers a lot of elements. Some of the elements are discussed below:
1. Working Capital Analysis
One of the most important components of Fundamental Analysis is the Working Capital Analysis. In simple words, Working Capital Analysis reflects whether there are sufficient current assets for the current liabilities that a company has.
In other words, it measures the liquidity of the company. The short term ability to cover the short term liabilities dictate how well-positioned the company is in the market.
Working Capital can be calculated by adding up the cash in hand, the accounts receivable and the inventory in hand, and subtracting the total from accounts payable and other accrued expenses.
2. Operating profit margin
Operating Profit margin is the ratio of Operating Income, divided by the total revenue of the firm. The ratio measures the profitability of the firm.
3. Free Cash Flow Analysis
Free Cash flow analysis measures the profitability of the firm after excluding the non-cash expenses of the income statement and including spending on equipment as well as changes in the Working Capital from the Balance Sheet. Free Cash Flow(FCF) Analysis reflects on the overall value of a company and may indicate the health of its trends.
4. Ratio Analysis
There are 8 simple ratio analysis tools to picture the overall functioning of a company and provide a reflection of where its valuation might be in the future.
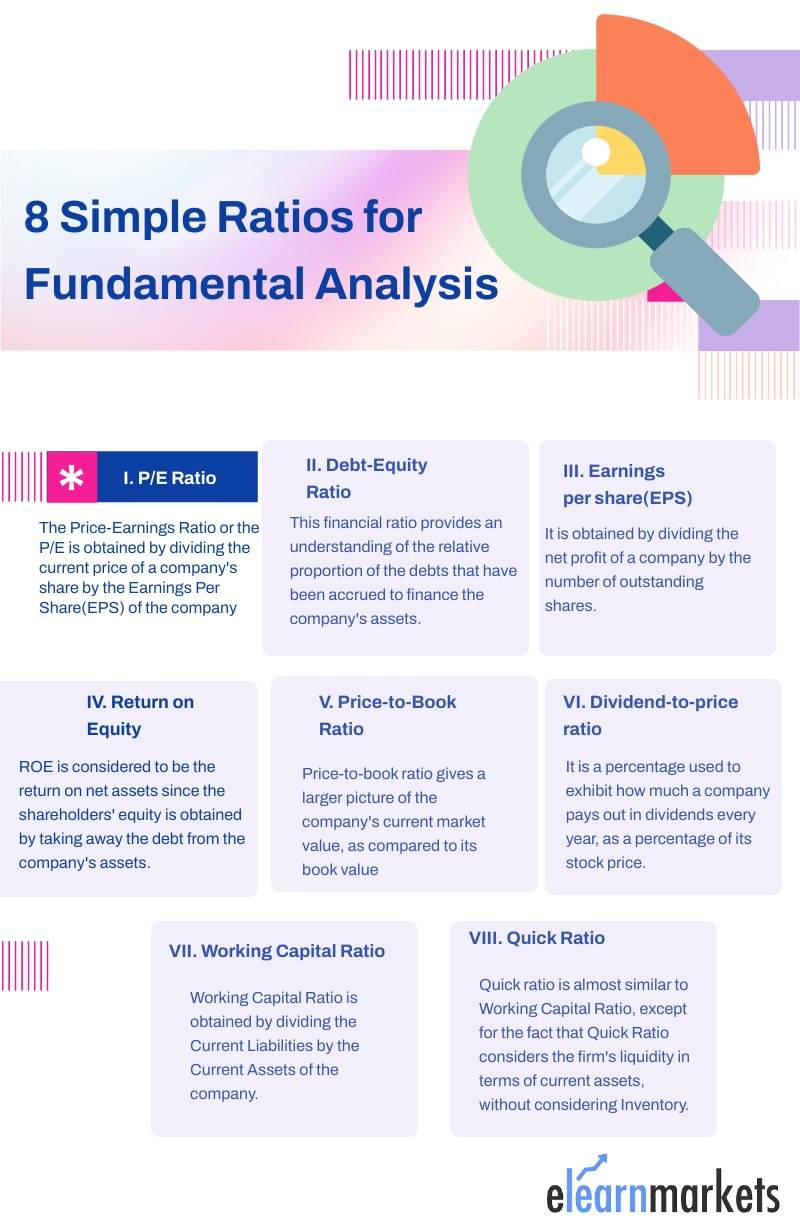
The ratios are as follows:
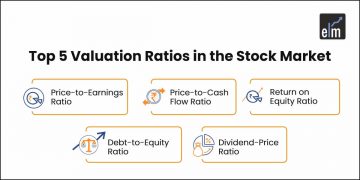
- P/E Ratio: The Price-Earnings Ratio or the P/E is obtained by dividing the current price of a company’s share by the Earnings Per Share(EPS) of the company. It provides a clear picture of the amount of money that investors would be willing to invest in a share of a company, for every rupee of its earnings.
- Debt-Equity Ratio: This financial ratio provides an understanding of the relative proportion of the debts that have been accrued to finance the company’s assets and the shareholders’ equity in the company. It is represented by dividing the total debt of the company by the shareholders’ equity.
- Earnings per share(EPS): EPS is the most widely used ratio as an indicator to measure a company’s profitability. It is obtained by dividing the net profit of a company by the number of outstanding shares.
- Return on Equity: Return on Equity(ROE) serves as a great instrument to measure the financial performance of a company by dividing the net income of the company by the shareholders’ equity. ROE is considered to be the return on net assets since the shareholders’ equity is obtained by taking away the debt from the company’s assets.
- Price-to-Book Value Ratio: Price-to-book value ratio gives a larger picture of the company’s current market value, as compared to its book value. It indicates how the company has performed over the years and indicates whether the company is overvalued or undervalued.
- Dividend-to-price ratio: It is a percentage used to exhibit how much a company pays out in dividends every year, as a percentage of its stock price. It is calculated by dividing the annual dividends per share by the Current share price in the market.
- Working Capital Ratio: The ability to pay off short-term liabilities(to be repaid within the next 12 months) with the current assets are often an indicator of the liquidity of the company. Working Capital Ratio is obtained by dividing the Current Liabilities by the Current Assets of the company. A low Working Capital ratio is often a Red signal in the financial market. As a general rule of thumb, a 2:1 ratio is always preferred.
- Quick Ratio: Quick ratio is almost similar to Working Capital Ratio, except for the fact that Quick Ratio considers the firm’s liquidity in terms of current assets, without considering Inventory. Hence, it gives a reflection on the ability of the firm to pay the current liabilities without having to sell their inventory.
5. Analyzing the Annual Reports of a Company
There is no better way to ascertain the financial position of a company in the market than to analyze the annual reports and look for indicators of growth or decline. One of the most useful indicators is the Profit and Loss(P/L) Statement.
A P/L statement provides a holistic view of the revenues, expenses incurred during the financial year or quarter. It indicates the company’s ability or inability to meet the expenses, while generating profit, increasing revenue, and reducing costs.
A trader or investor should always be in a position to read and analyze the P/L statement. The profit and loss statement has two distinct parts- the Revenue and the Expenses.
We obtain the total revenue by adding up the different kinds of revenues (products, services, additional operational) and taking away the excise duties paid. The various expenses are deducted from the total revenue to reach the profit before taxes.
We arrive at the Profit After Tax(PAT) after the various income taxes are deducted. Investors generally look at the PAT figure to estimate the ability of companies to generate a return on their investment. The calculation of PAT also incorporates both operating incomes, as well as income from other sources.
6. Expense Trends Analysis
Expense Trend Analysis(ETA) is a summarized report on the Expense of a company over time. A very common approach to generating an Expense Trends Analysis is to compute the change in expenses, keeping a base year and find the net change in expenses.
7. EBIT and EBITDA
Earnings before interest and taxes (EBIT) refers to the net income generated by the company before the interest and tax expenses are deducted. It gives a fair outlook on the performance of the company and its core operations, without considering tax expenses. The cost of capital structure eventually influences the profits.
The formula of EBIT is given by EBIT= Net Income + Interest Expense + Tax expense.
EBITDA, on the other hand, considers interest, taxes, depreciation and amortization as an indicator for the position of the company in terms of financial performance and earnings potential. EBITDA helps an investor ascertain the net cash flow of the company.
The formula for EBITDA is EBITDA= Net Income+Interest Expense+Tax Expenses + Depreciation + Amortization.
EBIT is generally considered to be a good indicator of how the company is performing, and EBITDA is an indicator of the spending power of the company. In the case of heavy-capital companies, EBITDA is useful, since a lot of the operating budget is eaten up by depreciation and amortization, and may give an incorrect idea of how well the company may be performing financially.
Factors affecting EBIT and EBITDA
Many internal and external factors affect the EBIT and EBITDA of a company. Inflation or deflation directly affects the cost of goods sold, raising input prices.
The government placed regulations, federal laws, wages law may increase the production process.
There can also be a sharp decline in the EBITDA margin if the company has emerging rivals. The company has to chalk out a plan to defend its market share, or its sales see a sharp decline.
Customer demand may also affect the EBITDA. With a volatile market with rapidly changing customer preferences, this has to be monitored all the time. For example, healthy cuisines and fitness-friendly diets have made their way into India. The fast-food joints must monitor the customer preferences, or they are sure to lose a huge chunk of market share.
8. Understanding the Balance Sheet
The Balance Sheet is a financial statement that summarizes the assets, liabilities, equity capital of a company at a specific point in time. It reflects the balance of the company as of a given date and helps the investors get an idea for evaluating the capital structure of a company and computing the rates of return. It is the main pillar while performing fundamental analysis of a company.
9. Debtor and Creditor Analysis
Debtors are the parties who owe the company money. The amount that is owed is repaid periodically, with or without interest. Depending on the type of financial undertaking, a debtor can be termed as a borrower or issuer(in the case of bonds).
A creditor is a party that provides money, hoping for the entire amount with some interest to be paid back in the future. Creditors are generally of two types- secured and unsecured. Secured creditors provide loans to the companies only after the company pledges some sort of collateral, which can be seized if the company fails to repay the loan.
Both the creditors and the shareholders are always exposed to the residual risk of companies that they invest in. Debt tends to be a form of company that stays throughout its life, and hence successful companies try to maintain a positive relationship with the creditors and shareholders, which ensures easy and cost-effective access to both debt and equity capital.
10. Major Shareholders in the Company
As an investor, it is important to have a background check into the companies which are the top shareholders of the company they are trying to invest in. For example, Tobacco Manufacturers India Ltd and Life Insurance Corporation of India are the top investors of ITC Limited. It is important to look into the performance of these companies, which might directly affect not just the relationship between the ITC and them, but also change the capital structure of ITC.
11. Other business incomes
With the above example of ITC, we can also discuss the other businesses of ITC. ITC is generally known for cigarettes, stationery, but has made its way into construction. However, as of March 2020, around 3013 crores are generated by ITC as other incomes, which is around 6.5% of the total revenue which is generated from operations. Hence, other incomes may significantly affect the balance of the company.
12. Long term liabilities
It is essential to analyze the long-term liabilities to know how the company will solve the long-term solvency of the company. It reflects how the company has planned its long-term finances and acquired its immediate capital to fund the purchase of capital assets or invest in new projects.
For example, as of March ’20, ITC has a total non-current liabilities of 2116 crores.
Understanding The Business Model of The Company
What is the Profit-making model of the business?
In a volatile, uncertain market, a company needs to stand out to survive. The first step comes in framing a business model that would ensure profits.
One example of a successful profit-making business is Swiggy which solved the convenience problem of going to restaurants and ordering food.
India has a large pool of corporate employees, who do not have the time or energy to visit restaurants or fast food joints after work. With a few clicks, Swiggy ensures delivery of food from restaurants all over the cities.
For this, Swiggy has partnered with restaurants as well as delivery agents. Swiggy takes a commission from every order received and delivered to the customers by the restaurant. The commission is supposed to be around 15-25% on the bill amount.
Promoter Background
In today’s cluttered market, having a profit-making business model is not enough. Promoting what you want to solve and how you want to solve it, is equally important. There comes the role of promotion. Indian business firms have run impactful campaigns that have had a profound impact on society. Ogilvie and Mather are known for their impactful campaigns. One famous example is the #LikeAGirl campaign which was run by P&G which tried to shatter some gender-related stereotypes.
Product Market Fit
At times, businesses fail simply because they are conducting business in the wrong market. Either the demand levels do not suit them, or they fail to read the pulse of the consumers, or their communicating strategies fail. One example is Kodak, which failed to see the change in paradigm from traditional analogue cameras to the birth of digital ones.
Founder-Market Fit
The vision, mission and strategies taken up by the founder/founders guide the company into action and chalk out the future. The personal experience, story, obsession and personality of the founder are key drivers of growth within the company.

Competitive Advantage
In a cluttered market like India, a company needs to stand out to survive. Every sector is having cutthroat competition, which necessitates the use of some differentiating factor that will set it apart from the competition. One great example would be Sensodyne, who entered a cluttered toothpaste market but focused on its unique selling point by addressing the issue of sensitivity.
Business Experience
The total experience of a business firm in the market dictates how well they can handle market pressure, changes in the internal, as well as external environment and ultimately, pave the way for growth in the future. A company with a long history of success, values are always a safe bet in the market.
Entry-Exit Barriers
Established firms create a lot of entry and exit barriers by using clever tactics to keep out the competition in the market. Some tactics involve reducing capital costs, cutting the cost of production, predatory pricing, use of patents, advertising and marketing better, using economies of scale.
Innovative capabilities
Innovation dictates the world. The way Apple revolutionized Mobile phones, or the way Uber revolutionized cab services goes on to prove that innovation not only reflects in social upliftment but also ensures a competitive edge for the brands too.
SWOT Analysis
SWOT analysis is a stretch planning tool that helps a firm analyze its internal and external environment to determine its strengths, weaknesses, opportunities and threats. A critical analysis of the internal environment provides the firm with its intrinsic strengths or weaknesses. For example, a healthy working environment can be a strength for a firm since it ensures low employee turnover, more employee satisfaction leading to productivity. An example of weakness can be low employee morale, low salaries compared to others in the industry.
Opportunities and threats can be identified by scanning the external environment, including political, legal, economic, and social factors that impact a company. A significant opportunity can arise from government measures aimed at boosting tourism in the country, which can positively impact tourism stocks. Conversely, a potential threat could be political turmoil within the country, which may negatively affect the tourism industry and related stocks.
Sector/ Industry Analysis
Analyzing the growth of the entire sector/industry is crucial before investing in a company. A general direction of growth ensures the possibility of the companies in the industry following the same trajectory.
A growth industry in an economy is one that, on average, experiences a higher growth rate, as compared to other sectors. The demand for the products/services in the industry sees massive highs.
India has seen a humongous rise in the Educational Technology sector due to the pandemic, with big names like Byju’s, UpGrad, Whitehat Jr, Khan Academy, Classplus etc. The Educational technology sector is expected to grow from USD$ 2.8 billion to 10.4 billion by 2025.
On the other hand, the IT Services sector is slowly getting saturated in India.
Industry analysis can be another market assessment tool, which can be useful to understand the level of market saturation and competitiveness. Porter’s five forces model is often used to assess the competitiveness of the industry. Analyzing the industry equips investors with knowledge about the overall performance of the industry, the opportunities and threats faced by it.
Future prospects
Analyzing the future prospects of various sectors is essential to predict the future market price. For example, the Indian civil aviation industry has been emerging as one of the fastest-growing industries in India, with the market being the third-largest domestic aviation market in the world. From FY16-FY20, the sector grew at a CAGR of 11.3%. The Indian passenger traffic stood at around 341.05 million. The freight traffic also grew at a CAGR of 5.32% and it is expected that it will grow at a CAGR of 7.27% in FY23.
How different companies fared in a sector
We take the example of the automobile stocks. Tide Water Oil Company has seen a massive increase in the market cap(20%). Among the gainers are Sundaram Clayton, Tata Motors(1%), Bajaj Auto(1.9%) to name a few. Fiem, Sharda Motors, Hindustan Motors have been the highest gainers while Cummins India, Pricol, Tube Investments of India have been the losers.
Maruti Suzuki, Eicher, TVS, Exide have seen some dip in terms of Market Cap.
Tools for Fundamental Analysis of stocks
StockEdge has been one of the best applications for undertaking Fundamental Analysis and getting a holistic view of the Indian market.
It is a one-stop application for Investor portfolios, Industry Analysis, Edge Reports, Investment ideas, the combined data of various business houses. StockEdge also contains interactive Edgecharts and over 300 advanced scans so that an investor can pick the best stocks to ensure long term profits.
With anniversary year deals with 35% off on StockEdge Premium, and 25% off on StockEdge Club, one can be self-reliant in their trading and fundamental analysis faster and easier.
Trusted by over a million investors, StockEdge is the perfect solution for those who are looking to earn big profits in the stock market.
Webinars on Fundamental Analysis
To get more in-depth information on Fundamental Analysis, we recommend the following webinars to get you started:
- Learn The Art Of Identifying Multibagger Stocks With Latest Examples
- Become Your Own Portfolio Manager
- How To Detect Manipulation In Financial Statements
- Identifying Bluechip Stocks For Profitable Investments
Key takeaways
- Fundamental analysis includes both industry/sector-specific, as well as company research.
- Fundamental analysis can be done using both qualitative as well as quantitative methods.
- Statements like Cash Flow Statement, Balance Sheet, Income statement should be used in tandem to analyze the financial position of the company.
- The investor must also take into account the Business model, competitive advantage, management, promoter Background of the company to conclude.
- Investors need to look at not only the present data but also the prospects in industries to select the best stocks to invest in.
To learn more, join our stock market analysis courses.
Tell us if you want to carry out a fundamental analysis of a company and which one would be your pick by commenting below!


is this a live Webinar or Recorded one.
course Duration.
timing etc
Hi,
You can check the details of the webinars
Thank you for Reading!
Thank you for such a lucid article. I have NEVER seen a page so simply explaining the basics of FA. Most websites talk and talk at length about this and that and don’t drill down to the basics of “This is what you need and no more”. And when you visit the blogs of people who write about FA for specific companies you leave with only Awe and of course “I can’t do all that!” feeling.
This one site however is refreshingly simple and to the point. Thanks!
Hi,
We really appreciated that you liked our blog! Thank you for your feedback!
Keep Reading!