Key Takeaways:
- Swing trading is a type of trading strategy that mainly focuses on making profits by trend changes over short timeframes.
- The positions are held for a few days to weeks if the trade remains profitable.
- Swing trading and day trading may seem the same, but there are major differences between these two trading strategies.
- In this type of trading strategy, a trader makes a profit from the move or the swing in the movement of the price in a specific direction.
When learning about the technical basics, you must have come across the term “Trade with the trends”
Swing Trading involves trading with the trends.
It is a strategy that focuses on incurring smaller profits in short term trends.
| Table of Contents |
|---|
| What is Swing Trading? |
| Day Trading vs Swing Trading |
| Swing Trading Strategies |
The profits might be smaller, but one can consistently compound into good annual returns over time
Swing Trading positions are held a few days to a couple of weeks, but it can also be held longer.
Let us drive into this in detail, the difference between day trading and swing trading and also swing trading strategies:
What is Swing Trading?
Swing trading is a type of trading strategy that mainly focuses on making profits by trend changes over short timeframes.
In this, the positions are held for a few days to weeks if the trade remains profitable.
Swing traders trade can find many trading opportunities by using different technical indicators for identifying patterns, the direction of the trend, and also potential short-term changes in trend.
Day Trading vs Swing Trading:
Swing trading and day trading may seem the same, but there are major differences between these two trading strategies.
Firstly, the time frames to hold trade are different. Day traders usually square off their trades within minutes or hours whereas Swing traders hold their positions over days or weeks.
Secondly, day trading involves attention as they are constantly searching for new trading opportunities throughout the day.
Whereas swing traders have a few transactions some days so they can periodically monitor their trades.
Thirdly, Day trading is usually done by analyzing price actions and technical indicators whereas swing trading can be done using both technical and fundamental analysis.
Swing Trading Strategies:
In this type of trading strategy, a trader makes a profit from the move or the swing in the movement of the price in a specific direction.
Learn the techniques to Find the Right Swing Trading Strategy in just 2 hours by Market Experts
Before going to the strategies, you should understand the following terms:
- Entry Point: It the point where the traders enter their trade position that can be determined by technical indicators.
- Exit Point: It the point where the traders square off their trade position that can be determined also by technical indicators.
- Stop Loss: Placing a stop loss is very important as it helps the traders to incur fewer losses.
One should also note that these strategies can only be applied to the trending market.
Now let us discuss different technical indicators that can be used to enter or exit swing trading:
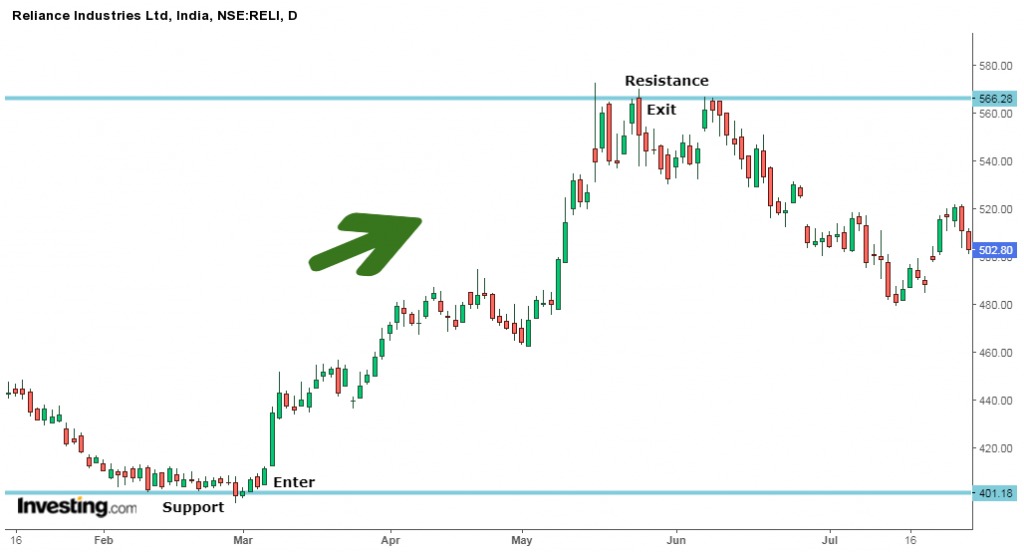
1. Support and Resistance:
Support is the region where there is enough buying pressure to make the prices bounce back to upward direction and it results in a reversal from downtrend to an uptrend.
A trader can enter a buy position when there is a bounce-back of the prices from the support level.
Similarly, Resistance is the region where there is enough selling pressure to make the prices bounce back to the down direction and it results in a reversal from an uptrend to downtrend.
A trader can exit a buy position or enter a sell position when there is a bounce-back of the prices from the resistance level.
Below is the daily chart of Reliance Industries Ltd that shows us how Support and Resistance helping us in entering or exiting our swing trade:
2. Moving Average:
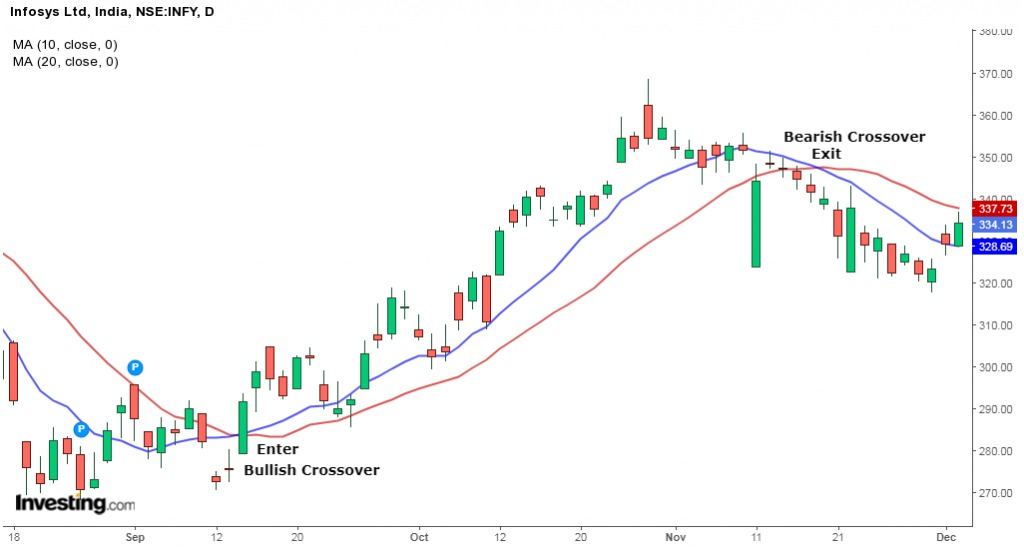
Swing Traders can use Simple Moving Average (SMA) 10 and 20 for finding the entry and exit points for their swing trading.
When the SMA 10 crosses SMA 20 from below there is a bullish crossover and when the simple moving average 10 crosses SMA 20 from above there is bearish crossover.
When there is a bullish crossover, a swing trader can enter a buy position and when there is bearish crossover trader can exit the position as shown in the below chart of Infosys Ltd:
3. MACD Crossovers:
MACD Crossovers is one of the most popular indicators that is used for determining the trend direction and reversals.
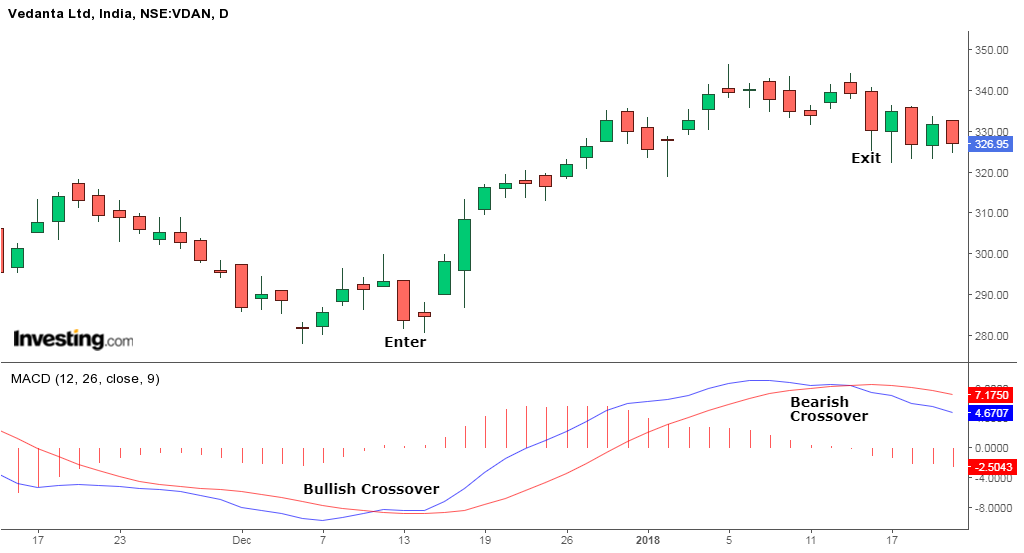
The MACD consists of two moving averages that are the MACD line and signal line.
The buy and sell signals are generated when these two lines cross each other.
Suggested Read – How to Filter Market Phases through MACD Indicator
When the MACD falls below the signal line, it is a bearish signal which indicates that it may be time to sell.
Similarly, when the MACD rises above the signal line, the indicator gives a bullish signal, which suggests that the price of the asset is likely to experience upward momentum.
Here is the example of MACD bullish and bearish crossovers:
4. Bollinger Bands:
Swing trading with the help of Bollinger bands is one of the most popular techniques.
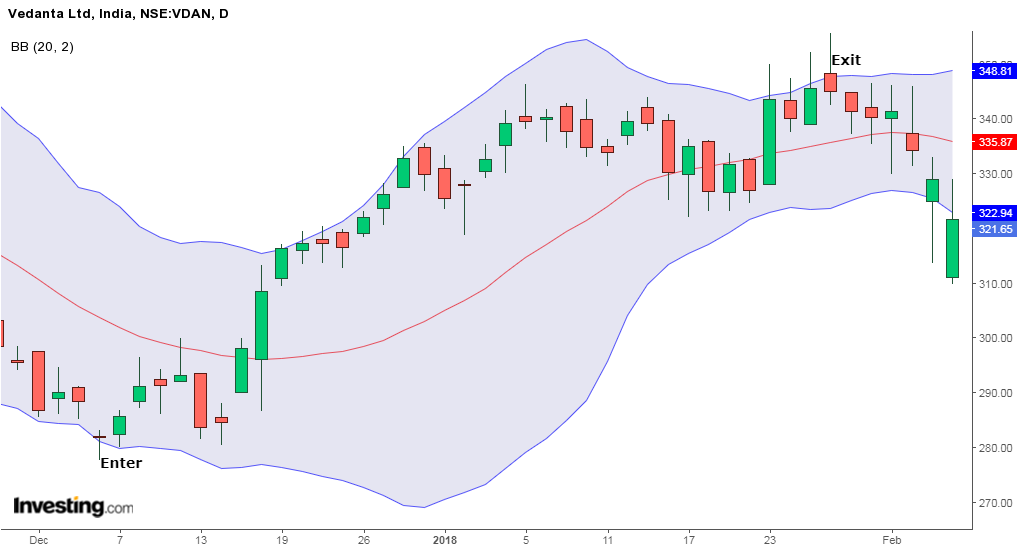
One can use this indicator to find out trades for swing trading in the following ways:
- One should wait for the prices to touch the lower band.
- Candlesticks can also be analyzed to enter the buy position once it touches the lower band.
- Further trend confirmation is made when the prices pass the middle band.
- Exit your position when the prices touch the upper band and reverse into a downtrend.
Below is the example of daily chart of Vedanta Ltd. that will help you to understand the above points:
5. Fibonacci Retracement:
The Fibonacci retracement pattern can also be used for identifying support and resistance levels, as well as the reversal levels.
Fibonacci ratios such as 23.6%, 38.2%, and 61.8% can be used as the potential reversal levels.
A swing trader can enter a sell position if the price in a downtrend retraces to and bounces off the 61.8% retracement level that acts as a resistance level.
They can exit the sell position when price moves down and bounces off the 23.6% Fibonacci line that acts as a support level.
In addition to these technical analysis indicators as discussed above, one should also know fundamental analysis as well.
Remember to place stop loss in your swing trades as it will help you to reduce your losses if the trades do not go in your favor.
Happy Learning!



nice blog
Hi,
Thank you for reading our blog!!
Keep Reading!
Have you teaching intraday trends
Hi,
You can refer to our blog on Intraday Trading
Keep Reading!
Best explanation
Thanks 😊 🙏
Hi,
We really appreciated that you liked our blog.
Keep Reading!