Elearnmarkets - Financial Market Learning
  • Courses
  • Webinars
  • Stories
  • Language
    • English
    • Hindi
    • Bengali
No Result
View All Result
Get Free Course
  • Basic Finance
  • Derivatives
    • Futures
    • Options
  • Financial Planning
  • Fundamental Analysis
  • Technical Analysis
  • Mutual Funds
  • Marketshala
  • Miscellaneous
Elearnmarkets - Learn Stock Market, trading, investing for Free
  • Courses
  • Webinars
  • Stories
  • Language
    • English
    • Hindi
    • Bengali
No Result
View All Result
Get Free Course
Elearnmarkets - Learn Stock Market, trading, investing for Free
No Result
View All Result
Home Fundamental Analysis
Sales Forecasting Methods - How to forecast future sales growth? 1

Sales Forecasting Methods – How to forecast future sales growth?

Elearnmarkets by Elearnmarkets
November 25, 2024
in Fundamental Analysis
Reading Time: 9 mins read
0
6.2k
VIEWS
Share on FacebookShare on XShare on WhatsApp

During our school or college, either our parents or our teachers used to forecast our results before its announcements and we used to be very panicky about its outcome. Right ? Similarly, the companies before announcing their results have a mechanism in place by analysts who use sales forecasting method to understand their results based on some data points.

Thus Forecasting is a technique that uses historical data as inputs for making estimates that are predictive in determining the direction of future trends.

Table of Contents
Historical Average
Industry growth
EIC Analysis
Bottomline

Sales forecasting method is the process of estimating future sales. It is one of the most important components of stock analysis.

Making forward projections requires numerous inputs, some come from quantitative data and others are more subjective.

To forecast sales, investors can gather data from the Company’s annual report, Con calls, Industry report, brokerage houses reports, rating agencies report, and global organizations like IMF.

There are various sales forecasting method that investor can use to predict future sales of the company.

In this article, we will focus on these methods i.e.,

(1) Historical average,

(2) Industry growth,

(3) EIC analysis

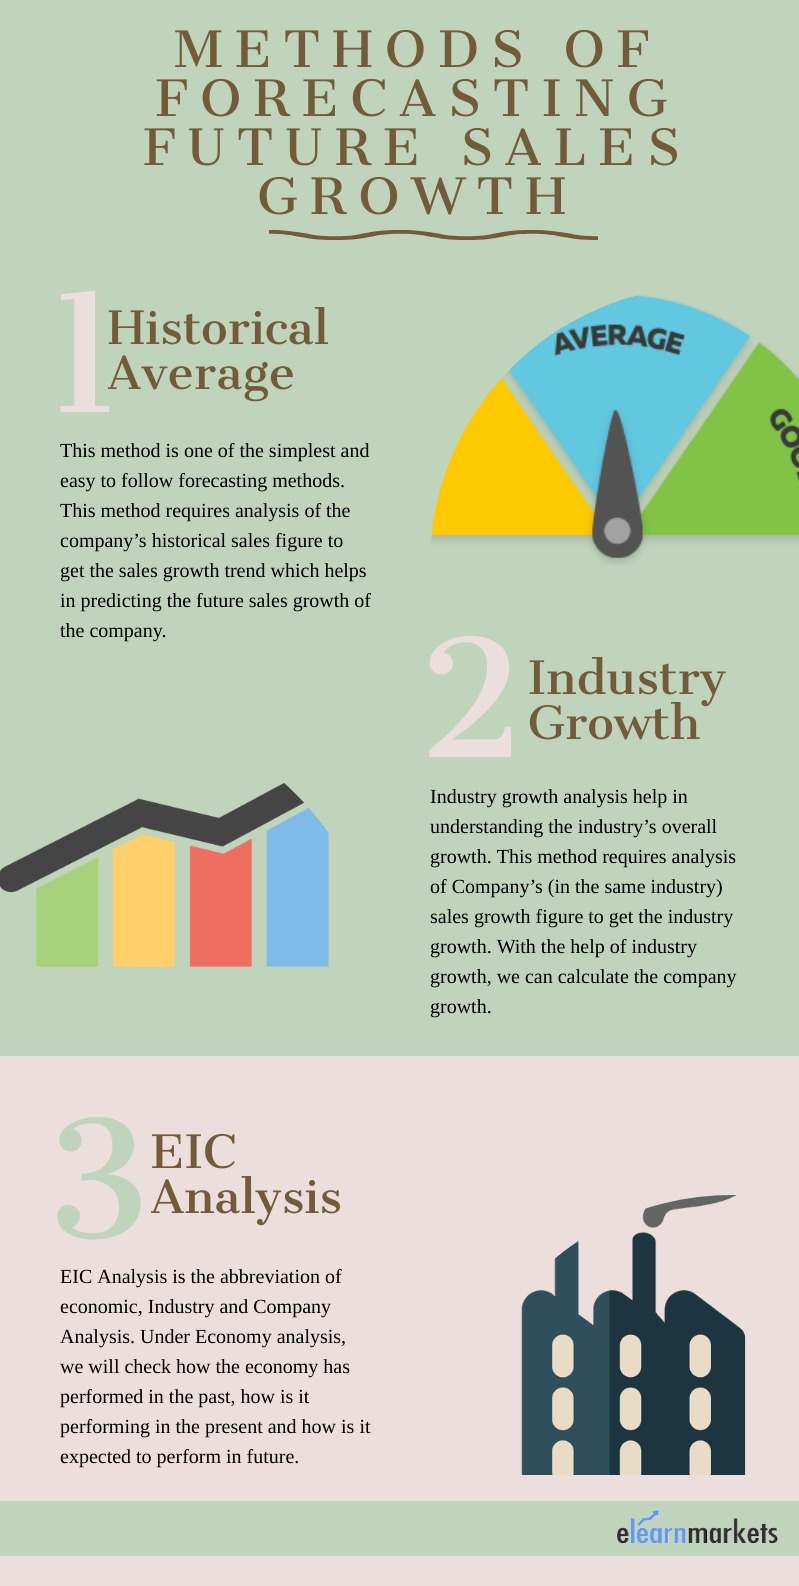
1) Historical Average:-

This method is one of the simplest and easy to follow forecasting sales forecasting method. This method requires analysis of the company’s historical sales figure to get the sales growth trend which helps in predicting the future sales growth of the company.

In the example provided below, we will look at how Historical average forecasting can be done.

The first step in Historical average forecasting is to take 5-year sales figure of the company.

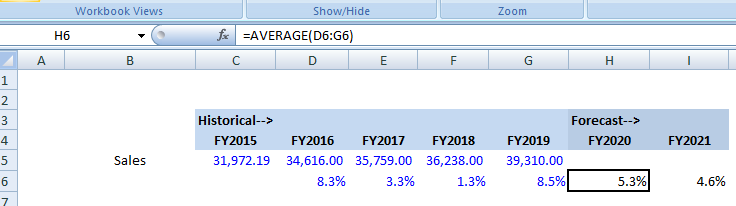
We have taken Hindustan Unilever Ltd. as an example:

To calculate the sales growth in the excel sheet, we use the formula:- (Current year/Previous year-1) and by using =AVERAGE formula we can find out the sales growth rate of the company for FY2020 i.e., 5.3% for HUL.

sales growth

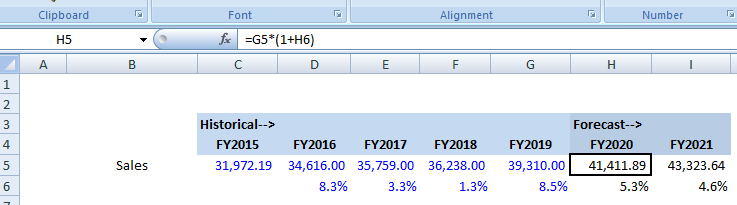
To forecast future Sales, we take the previous year’s figure and multiply it by the growth rate of FY2020.

The formula used to calculate FY2020 sales is =G5*(1+H6). After that select cell H5 to I5, then use Ctrl+R to copy the formula all the way to the right.

historical sales forecasting method

2) Industry growth:-

Industry growth analysis help in understanding the industry’s overall growth. This method requires analysis of Company’s (in the same industry) sales growth figure to get the industry growth. With the help of industry growth, we can calculate the company growth.

For calculating the industry growth, we will take the sales figure of peer companies and find the growth trend of the industry.

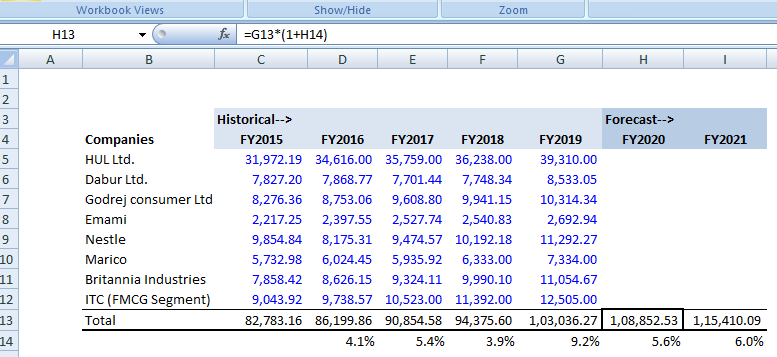
In case of Hindustan Unilever Ltd, we have collected the sales data of few of its close peers in the FMCG Industry.

We will add all the sales figure of the companies and find the Year on Year growth of the industry.

Learn about Company Valuation with the help of Market Experts

After that we apply =AVERAGE formula, to get the forecasted industry growth rate i.e., 5.6% for FY2020 and 6% For FY2021.

With the help of FY2020 growth rate, we calculate the Total industry sales for FY2020 as given below.

company sales forecasting method

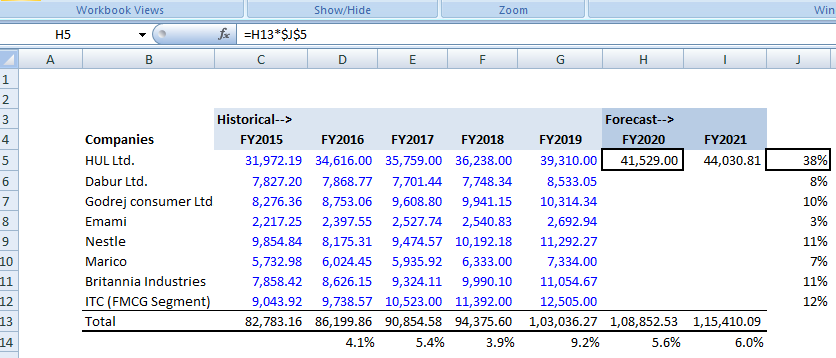
Now we have to calculate the Hindustan Unilever Ltd. contribution as a % of Total industry.

For calculating this, we will do G5/G13*100 of FY2019.

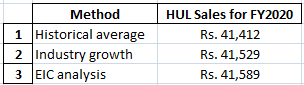
After that we will multiply FY2020 Total with 38% (HUL contribution as a percentage of sales) to get the Forecasted sales figure of Hindustan Unilever ltd. for FY2020 which is Rs. 41,529 crore as given below.

industry growth chart

3) EIC Analysis:-

EIC Analysis is the abbreviation of economic, Industry and Company Analysis. It is one of the best sales forecasting method.

Under Economy analysis, we will check how the economy has performed in the past, how is it performing in the present and how is it expected to perform in future.

Industry and company growth are interlinked and largely depend upon economic growth.

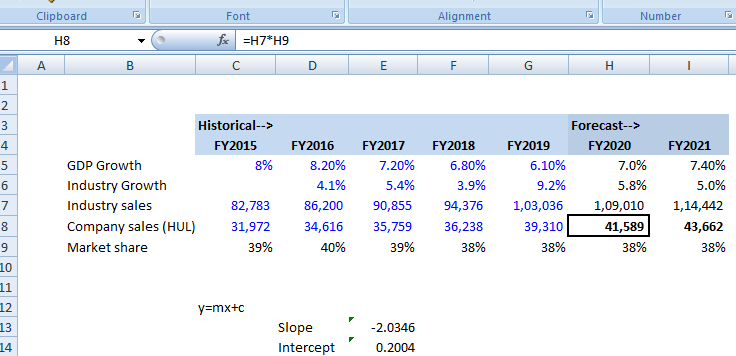
Economic growth is measured by GDP. We can use IMF (International Monetary Fund) forecasted GDP growth rate to analyse which is 7% for FY2020.

We will go step by step for further calculation.

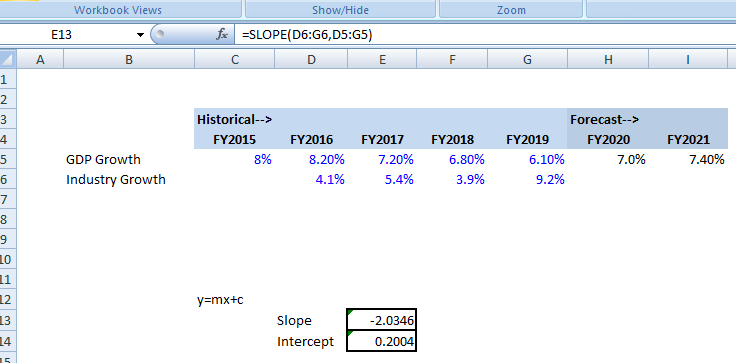
Step 1:- To find the industry growth rate we will use the equation i.e., y=mx+c.
y = mx + c is the equation of a straight line where m is the slope of the line and c is the intercept.

To find the slope, we will use the formula i.e., =SLOPE (Industry growth, GDP growth) and for calculating intercept, we use the formula i.e., =INTERCEPT (Industry growth, GDP growth) of previous years as shown in the example.

eic sales forecasting method

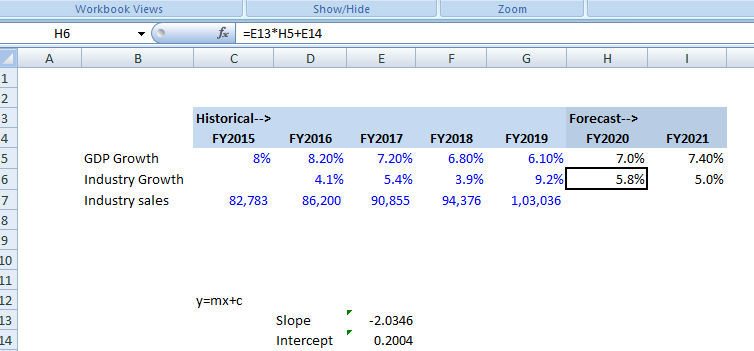
Step 2:- By using the slope and Intercept, we will calculate the industry growth rate for FY2020.

For this we will use formula {slope (m)*GDP growth of FY20+Intercept (c)} and we get the Industry growth rate i.e., 5.8% for FY2020 as shown in the image below.

eic analysis formula

Step 3:- As we know the industry growth rate for FY2020, we can easily calculate industry sales for FY2020. For this we will do (FY2019 Industry sales*(1+FY2020 Industry growth rate) i.e., 1,09,010 crore.

historical data

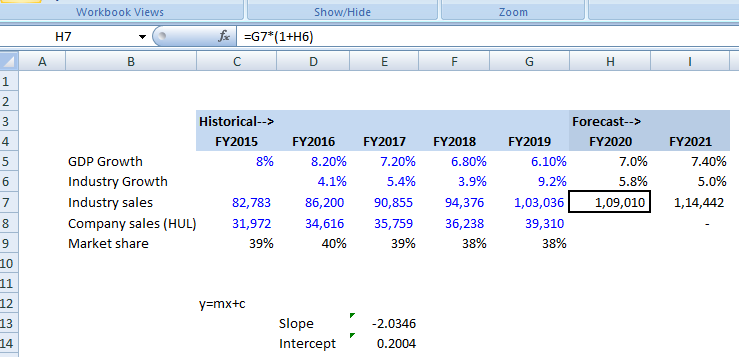
Step 4:– Now we will take Hindustan Unilever sales of the previous year. With the help of Hindustan Unilever (company) sales and industry sales, we will calculate the market share of the company in the industry.

For calculating market share we will do (Company sales/Industry sales*100) as given in the image.

hindustan unilever sales

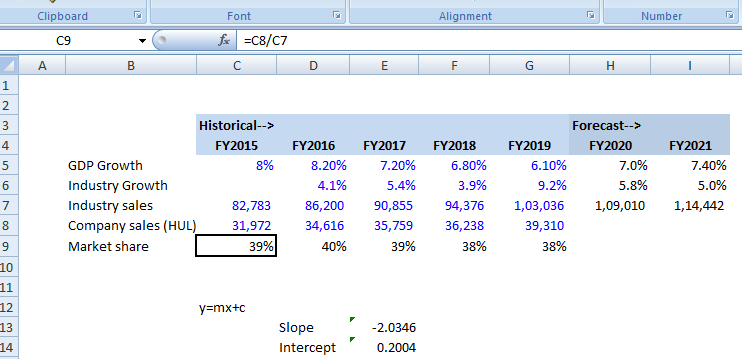
Step 5:- By analyzing the market share of previous years, we are taking 38% for FY20 and FY21.

With the help of forecasted market share, we can easily calculate the company sales for FY2020.

For this we multiply (Industry sales for FY2020*Market share of FY2020). We get Rs. 41,589 crore sales in FY2020 for HUL as shown in the image.

market share data

By Forecasting from three methods, we get the sales of Hindustan Uniliver limited for FY2020.i.e.,

Also Read: Free Cash Flow to Firm (FCFF) – Forecasting P/L, B/S & C/F Statements

There are various factors an investor should also focus while forecasting the sales of the company because these factors can affect the sales growth of the company.

Sales Forecasting Methods - How to forecast future sales growth? 2

  • Penetration into new or existing markets by the company.

  • Launching new products or services.

  • Expansion of company’s distribution networks/ channels and improving customer service.

  • Change in marketing strategy by the management.

  • Gaining market share in the industry.

Gain advanced data analysis skills with Advanced Excel Course. Join our course and start making data-driven decisions today!

Sales Forecasting Methods - How to forecast future sales growth? 3

Bottomline

  • Sales forecast requires the compilation of subjective determination and many quantitative data points from a variety of sources.

  • If a company is cyclical in nature, then these methods of forecasting will not be used.

  • Sales growth forecast of a company varies on the respective analyst’s assumption.

  • Investors can use forecasting to determine company’s sales growth in future because it can affect the prices of share in that company.

  • Many a time, management is able to provide sales growth guidance for the coming years. Investor can use that guidance in your forecast and estimate the sales in the coming years.

Ready to master predicting trends? Learn futures and options trading for accurate sales forecasting insights!

We hope this has been a helping guide for those of you who want to forecast the sales of the company. The other forecasting also works on a similar manner.

Tags: advancedenglishfundamental analysisfundamental analysis of a company
Share11TweetSend
Get Kotak Offer Get Kotak Offer Get Kotak Offer
Previous Post

How to use Support and Resistance levels for Trading?

Next Post

Difference between Offer For Sale, Qualified Institutional Placement, and Follow on Public Offer

Elearnmarkets

Elearnmarkets

Elearnmarkets (ELM) is a complete financial market portal where the market experts have taken the onus to spread financial education. ELM constantly experiments with new education methodologies and technologies to make financial education effective, affordable and accessible to all. You can connect with us on Twitter @elearnmarkets.

Related Posts

Top 5 Valuation Ratios in the Stock Market 4
Fundamental Analysis

Top 5 Valuation Ratios in the Stock Market

May 5, 2025
823
price to sales ratio
Fundamental Analysis

Price to Sales Ratio: A Key Metric for Understanding Company Value

May 5, 2025
447
Gearing Ratio
Fundamental Analysis

What Is the Gearing Ratio? Formula & Calculation

December 3, 2024
1.1k
Top 5 Fundamental Analysis Tools 5
Fundamental Analysis

Top 5 Fundamental Analysis Tools

January 31, 2025
4.1k

Leave a Reply Cancel reply

Your email address will not be published. Required fields are marked *

Disclaimer

Elearnmarkets (Kredent InfoEdge Pvt. Ltd.) is a SEBI-registered Research Analyst (RA) entity (SEBI Registration No.: INH300007493). The information provided in this article is for educational and informational purposes only and should not be considered as an offer to buy or sell any securities or investment products.

The stocks, securities, and investment instruments mentioned herein are not recommendations under SEBI (Research Analysts) Regulations, 2014. Readers are advised to conduct their own due diligence and seek independent financial advice before making any investment decisions.

Investments in securities markets are subject to market risks. Please read all related documents carefully before investing. Investing in Equity Shares,
Derivatives, Mutual Funds, or other instruments carry inherent risks, including potential loss of capital. Elearnmarkets (Kredent InfoEdge Pvt. Ltd.) does not provide any guarantee or assurance of returns on any investments. Past performance is not indicative of future performance.

Elearnmarkets Logo

Follow Us

Facebook-f X-twitter Instagram Linkedin-in Youtube Telegram

Register on Elearnmarkets

Continue your financial learning by creating your own account on Elearnmarkets.com

Register Free Account

Download App

Playstore logo
Download on app store

Categories

  • Basic Finance
  • Derivatives
  • Financial Planning
  • Fundamental Analysis
  • Technical Analysis
  • Mutual Funds
  • Miscellaneous

Popular On Elearnmarkets

  • Market Superheroes:
  • Vivek Bajaj
  • Chetan Panchamia
  • Ashish Kyal
  • Premal Parekh
  • Abhijit Paul
  • Jegan
  • Sivakumar Jayachadran
  • Jyoti Budhia
  • Vivek Gadodia
  • Vishal Mehta
  • Piyush Chaudhry
  • Santosh Pasi
  • Gomathi Shankar
  • Market Superheroes:
  • Vivek Bajaj
  • Chetan Panchamia
  • Ashish Kyal
  • Premal Parekh
  • Abhijit Paul
  • Jegan
  • Sivakumar Jayachadran
  • Jyoti Budhia
  • Vivek Gadodia
  • Vishal Mehta
  • Piyush Chaudhry
  • Santosh Pasi
  • Gomathi Shankar
  • Courses:​
  • Options Trading
  • Dow Theory
  • Momentum Trading
  • Stock Investing
  • Harmonic Chart Patterns
  • Algo Trading
  • Elliot Wave Theory
  • Advanced Excel
  • Cryptocurrency
  • NSE Certification Course
  • Courses:​
  • Options Trading
  • Dow Theory
  • Momentum Trading
  • Stock Investing
  • Harmonic Chart Patterns
  • Algo Trading
  • Elliot Wave Theory
  • Advanced Excel
  • Cryptocurrency
  • NSE Certification Course
  • Webinars:
  • Bank Nifty Scalping
  • Intraday Trading Strategies
  • Options Trading Strategies
  • Options selling
  • Price Action
  • Relative Strength
  • Tax Planning
  • Options Buying
  • Growth Stocks
  • Portfolio Management
  • Risk Management
  • Renko Charts
  • Crude Oil
  • Traders Psychology
  • Moving Average
  • Multibagger Stocks
  • Free Learning Modules:
  • Intraday Trading
  • Options Scalping
  • Swing Trading
  • Financial Modelling
  • RSI Indicator
  • Bollinger Bands
  • Pricing of Futures
  • Personal Finance
  • Initial Public Offerings (IPO)
  • Value Investing
  • Technical Indicators
  • Candlesticks
  • Chart Patterns
  • Option Greeks
  • ELSS Funds
  • Banking and Insurance
  • Real Estate
  • Gold
  • Book Summaries:
  • Rich Dad Poor Dad
  • Psychology of Money
  • The Intelligent Investor
  • The Richest Man in Babylon
  • Think and Trade Like a Champion
  • Value Investing and Behavioural Finance
  • Trading in the Zone
  • Learn to Earn
  • Book Summaries:
  • Rich Dad Poor Dad
  • Psychology of Money
  • The Intelligent Investor
  • The Richest Man in Babylon
  • Think and Trade Like a Champion
  • Value Investing and Behavioural Finance
  • Trading in the Zone
  • Learn to Earn
  • Tools:
  • CAGR Calculator
  • SIP Calculator
  • eLearnOptions
  • Future Value Calculator
  • Present Value Calculator
  • Atal Pension Yojana
  • Cost of Delay Calculator
  • Become a Crorepati
  • Tools:
  • CAGR Calculator
  • SIP Calculator
  • eLearnOptions
  • Future Value Calculator
  • Present Value Calculator
  • Atal Pension Yojana
  • Cost of Delay Calculator
  • Become a Crorepati

© 2025 Elearnmarkets. All Rights Reserved

  • Visit Elearnmarkets
  • Courses
  • Webinars
  • Financial Guides
  • Get Free Counselling
  • Visit Elearnmarkets
  • Courses
  • Webinars
  • Financial Guides
  • Get Free Counselling

Download Our App

No Result
View All Result
  • Article Categories
    • Basic Finance
    • Derivatives
    • Financial Planning
    • Fundamental Analysis
    • Technical Analysis
    • ETFs & Mutual Funds
    • Marketshala
    • Miscellaneous
  • Language
    • Hindi
    • Bengali
    • English
  • Courses
  • Webinars
  • Stories
Get Free Course

© 2024 Elearnmarkets All Rights Reserved

Trading Day 2025