Elearnmarkets - Financial Market Learning
  • Courses
  • Webinars
  • Stories
  • Language
    • English
    • Hindi
    • Bengali
No Result
View All Result
Get Free Course
  • Basic Finance
  • Derivatives
    • Futures
    • Options
  • Financial Planning
  • Fundamental Analysis
  • Technical Analysis
  • Mutual Funds
  • Marketshala
  • Miscellaneous
Elearnmarkets - Learn Stock Market, trading, investing for Free
  • Courses
  • Webinars
  • Stories
  • Language
    • English
    • Hindi
    • Bengali
No Result
View All Result
Get Free Course
Elearnmarkets - Learn Stock Market, trading, investing for Free
No Result
View All Result
Home Fundamental Analysis
Quantify Stock Price Calculation using EPS, PE, and Growth% 1

Quantify Stock Price Calculation using EPS, PE, and Growth%

Elearnmarkets by Elearnmarkets
April 15, 2024
in Fundamental Analysis
Reading Time: 5 mins read
0
4.6k
VIEWS
Share on FacebookShare on XShare on WhatsApp

Stock markets are very volatile but as we know that they are the ones who have been providing us with consistent returns beating many kinds of alternate Investment tools like FD, EPF, PPF etc.

Whenever we speak about stock market Investment or read about the same, one question that plagues all minds is what its right price should be for investment and how one can quantify stock price calculation.

Whether it will give good returns or not.

How much can it grow etc.

But one more thing which is very important to know about a company is its Qualitative criteria.

A fatal mistake is, when one neither understands the Qualitative nor the Quantitative criteria of the company

Table of Contents
Stock Price Calculation Example
Disclaimer

But invests into it at a wrong price expecting a major kind of return.

No one wants to get stuck in the wrong Investment. So let us understand the difference between the wrong and the right investment.

This is a very apt kind of an Investment philosophy where you need to check whether or not that stock can fulfil your return expectations.

So let us take an example where we want to invest in only that stock which can give us a 25% kind of return every year for over 10 years.

Now this return can only happen if the earnings also support the stock.

So from the very beginning itself we should do our homework first before Investing and check out if our return expectation can be fulfilled by the company or not taking into account its historical returns.

Stock Price Calculation Example:

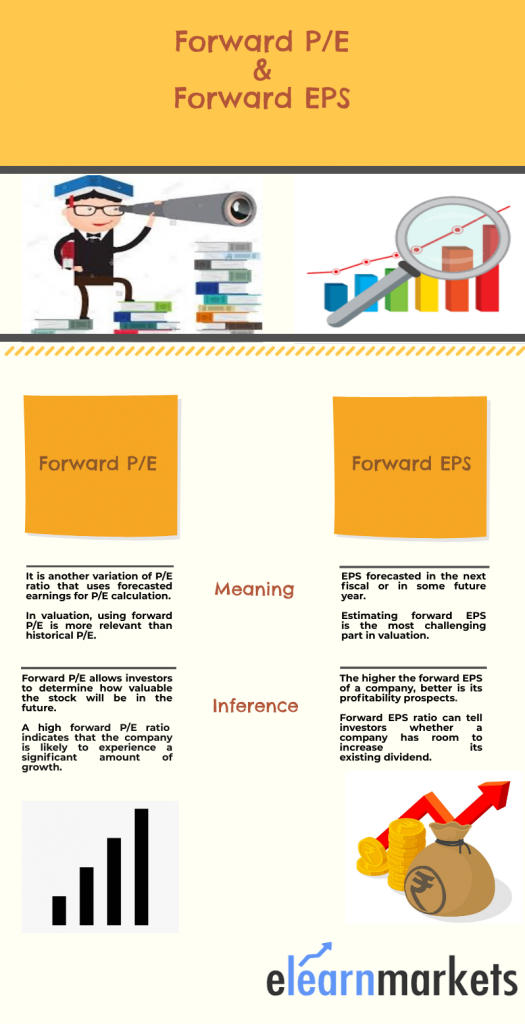
So let us take a case study of Bajaj Auto as our expected investment and do stock price calculation.

Now, we will take price of Bajaj Auto is Rs 2,731 and its trailing twelve month EPS is Rs. 180.11 thus the PE comes to 15.16x (Price / EPS or 2731/180.11)

Now since we expect to make 25% kind of return from the stock thus our stock price calculation after 10 years should be FV=PV(1+r)^n which means FV=(2731+0.25)^10=Rs 25,434.4

Evaluate your investments with Stock investing made easy Course by Market Experts

Suppose the maximum PE ratio at which we want to sell the stock is 17x times (as that has been the historic PE of the company). Thus at current price of Rs 25,434.4 the EPS of the stock would be 25434.4/25 or Rs 1496.14

From EPS of 180.11 to EPS of Rs 1496.14 in ten years means a CAGR growth of = ((FV/PV) ^ (1/n)-1)

Which means a CAGR growth of ((1496.14/180.11) ^ (1/10)-1) = 23%

Now one thing which we need to ask ourselves is that can Bajaj Auto EPS grow at a CAGR of 23%

You can also calculate CAGR our CAGR Calculator.

So for that we need to check its historic EPS growth which can be taken from any company’s Annual Reports.

So in this case we find that the historic EPS growth for Bajaj Auto for the last 10 years has mostly been in single digits.

Thus investment in this company may not give us our desired expectation of 25% kind of returns as the earnings are not suggestive of double digit growth so far.
stock price calculation ratio

Disclaimer:

There can be chances that the P/E multiple of the stock can rise further as a decade is a long time.

Also, historical performance cannot be the only barometer for future growth.

Thus every theory has its pros and cons but still homework is a must as that helps us to filter out stocks better opportunities.

Thus now does it not become easy for you to decide whether the stock can fulfil your return expectations or not.

In the similar manner you can also compare various stocks and their return potential and then invest into the one which can fulfil your return criteria.

Key Takeaways:

  • If our stock market Investment is well thought of and proper stock price calculation is done, then our chances of getting stuck in the wrong ones are lesser.
  • One should always do their homework first before investing in any stock.
  • One should always know the earning capacity of any company in which they want to invest.
  • Historic data is very important to check out on future expectation from any company.

You can learn more such concepts under one roof through our certificate course on valuation.

Happy Learning!

Tags: englishforward p/eintermediateinvestmentp/e
ShareTweetSend
Get Kotak Offer Get Kotak Offer Get Kotak Offer
Previous Post

Accounts Receivable – Formula, Importance & Impact

Next Post

Forward Contract – Definition, Example, Basics, & Risks

Elearnmarkets

Elearnmarkets

Elearnmarkets (ELM) is a complete financial market portal where the market experts have taken the onus to spread financial education. ELM constantly experiments with new education methodologies and technologies to make financial education effective, affordable and accessible to all. You can connect with us on Twitter @elearnmarkets.

Related Posts

Top 5 Valuation Ratios in the Stock Market 2
Fundamental Analysis

Top 5 Valuation Ratios in the Stock Market

May 5, 2025
822
price to sales ratio
Fundamental Analysis

Price to Sales Ratio: A Key Metric for Understanding Company Value

May 5, 2025
447
Gearing Ratio
Fundamental Analysis

What Is the Gearing Ratio? Formula & Calculation

December 3, 2024
1.1k
Top 5 Fundamental Analysis Tools 3
Fundamental Analysis

Top 5 Fundamental Analysis Tools

January 31, 2025
4.1k

Leave a Reply Cancel reply

Your email address will not be published. Required fields are marked *

Disclaimer

Elearnmarkets (Kredent InfoEdge Pvt. Ltd.) is a SEBI-registered Research Analyst (RA) entity (SEBI Registration No.: INH300007493). The information provided in this article is for educational and informational purposes only and should not be considered as an offer to buy or sell any securities or investment products.

The stocks, securities, and investment instruments mentioned herein are not recommendations under SEBI (Research Analysts) Regulations, 2014. Readers are advised to conduct their own due diligence and seek independent financial advice before making any investment decisions.

Investments in securities markets are subject to market risks. Please read all related documents carefully before investing. Investing in Equity Shares,
Derivatives, Mutual Funds, or other instruments carry inherent risks, including potential loss of capital. Elearnmarkets (Kredent InfoEdge Pvt. Ltd.) does not provide any guarantee or assurance of returns on any investments. Past performance is not indicative of future performance.

Elearnmarkets Logo

Follow Us

Facebook-f X-twitter Instagram Linkedin-in Youtube Telegram

Register on Elearnmarkets

Continue your financial learning by creating your own account on Elearnmarkets.com

Register Free Account

Download App

Playstore logo
Download on app store

Categories

  • Basic Finance
  • Derivatives
  • Financial Planning
  • Fundamental Analysis
  • Technical Analysis
  • Mutual Funds
  • Miscellaneous

Popular On Elearnmarkets

  • Market Superheroes:
  • Vivek Bajaj
  • Chetan Panchamia
  • Ashish Kyal
  • Premal Parekh
  • Abhijit Paul
  • Jegan
  • Sivakumar Jayachadran
  • Jyoti Budhia
  • Vivek Gadodia
  • Vishal Mehta
  • Piyush Chaudhry
  • Santosh Pasi
  • Gomathi Shankar
  • Market Superheroes:
  • Vivek Bajaj
  • Chetan Panchamia
  • Ashish Kyal
  • Premal Parekh
  • Abhijit Paul
  • Jegan
  • Sivakumar Jayachadran
  • Jyoti Budhia
  • Vivek Gadodia
  • Vishal Mehta
  • Piyush Chaudhry
  • Santosh Pasi
  • Gomathi Shankar
  • Courses:​
  • Options Trading
  • Dow Theory
  • Momentum Trading
  • Stock Investing
  • Harmonic Chart Patterns
  • Algo Trading
  • Elliot Wave Theory
  • Advanced Excel
  • Cryptocurrency
  • NSE Certification Course
  • Courses:​
  • Options Trading
  • Dow Theory
  • Momentum Trading
  • Stock Investing
  • Harmonic Chart Patterns
  • Algo Trading
  • Elliot Wave Theory
  • Advanced Excel
  • Cryptocurrency
  • NSE Certification Course
  • Webinars:
  • Bank Nifty Scalping
  • Intraday Trading Strategies
  • Options Trading Strategies
  • Options selling
  • Price Action
  • Relative Strength
  • Tax Planning
  • Options Buying
  • Growth Stocks
  • Portfolio Management
  • Risk Management
  • Renko Charts
  • Crude Oil
  • Traders Psychology
  • Moving Average
  • Multibagger Stocks
  • Free Learning Modules:
  • Intraday Trading
  • Options Scalping
  • Swing Trading
  • Financial Modelling
  • RSI Indicator
  • Bollinger Bands
  • Pricing of Futures
  • Personal Finance
  • Initial Public Offerings (IPO)
  • Value Investing
  • Technical Indicators
  • Candlesticks
  • Chart Patterns
  • Option Greeks
  • ELSS Funds
  • Banking and Insurance
  • Real Estate
  • Gold
  • Book Summaries:
  • Rich Dad Poor Dad
  • Psychology of Money
  • The Intelligent Investor
  • The Richest Man in Babylon
  • Think and Trade Like a Champion
  • Value Investing and Behavioural Finance
  • Trading in the Zone
  • Learn to Earn
  • Book Summaries:
  • Rich Dad Poor Dad
  • Psychology of Money
  • The Intelligent Investor
  • The Richest Man in Babylon
  • Think and Trade Like a Champion
  • Value Investing and Behavioural Finance
  • Trading in the Zone
  • Learn to Earn
  • Tools:
  • CAGR Calculator
  • SIP Calculator
  • eLearnOptions
  • Future Value Calculator
  • Present Value Calculator
  • Atal Pension Yojana
  • Cost of Delay Calculator
  • Become a Crorepati
  • Tools:
  • CAGR Calculator
  • SIP Calculator
  • eLearnOptions
  • Future Value Calculator
  • Present Value Calculator
  • Atal Pension Yojana
  • Cost of Delay Calculator
  • Become a Crorepati

© 2025 Elearnmarkets. All Rights Reserved

  • Visit Elearnmarkets
  • Courses
  • Webinars
  • Financial Guides
  • Get Free Counselling
  • Visit Elearnmarkets
  • Courses
  • Webinars
  • Financial Guides
  • Get Free Counselling

Download Our App

No Result
View All Result
  • Article Categories
    • Basic Finance
    • Derivatives
    • Financial Planning
    • Fundamental Analysis
    • Technical Analysis
    • ETFs & Mutual Funds
    • Marketshala
    • Miscellaneous
  • Language
    • Hindi
    • Bengali
    • English
  • Courses
  • Webinars
  • Stories
Get Free Course

© 2024 Elearnmarkets All Rights Reserved

Trading Day 2025