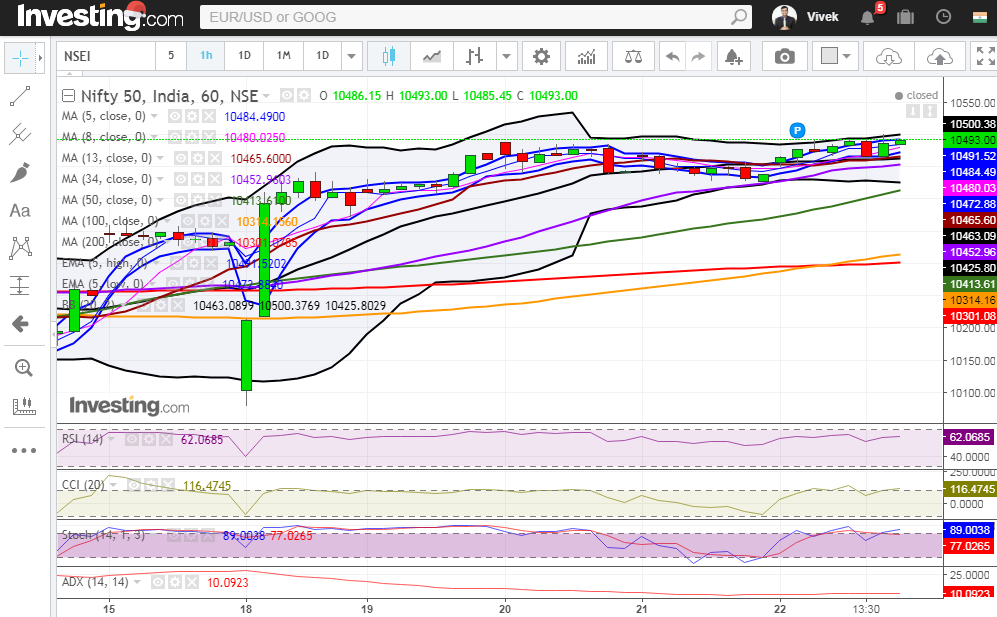
Nifty close 10493: Nifty ended at record closing high ahead of long weekend for Christmas holiday. The benchmark indices witnessed buying in the second half on Friday’s session and rose 52.70 points to close at 10,493.
Hourly Technical:
In the hourly chart, Nifty is trading above most short term moving averages. The probable support in the hourly chart comes at 20 Hour moving average (presently at approx. 10464), 34 Hour moving average (presently at approx. 10453) and 50 Hour moving average (presently at approx. 10414).
On the upside, Nifty may face resistance at Upper Bollinger line (presently at approx. 10500).
Hourly Stochastic and CCI are in the overbought zone while RSI is very close to the upper bound. Moreover, the ADX is upward sloping indicating strong momentum in the hourly chart. Overall, Nifty remained bullish in the Hourly chart.
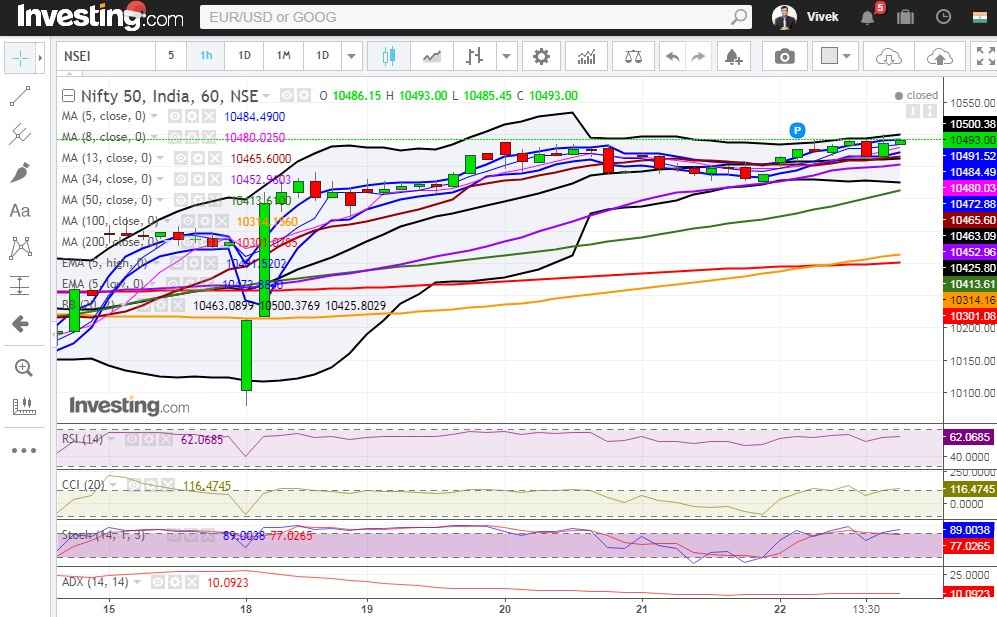
Figure: Nifty Hourly Chart
Daily Technical:
In the daily chart, Nifty hits a fresh record high and closes above 5 Day High EMA and other short term moving averages which are very positive trigger in daily timeframe.
The probable support in the daily chart comes at 5 Day High EMA (presently at approx.10463) and 5 DMA (presently at approx.10446).
On the upside, Nifty may face resistance at Upper Bollinger line (presently at approx.10546).
Daily Stochastic and CCI are in the overbought zone while RSI is very close to the upper bound. Moreover, the ADX is upward sloping indicating strong momentum. Overall, Nifty remained bullish in the daily chart.
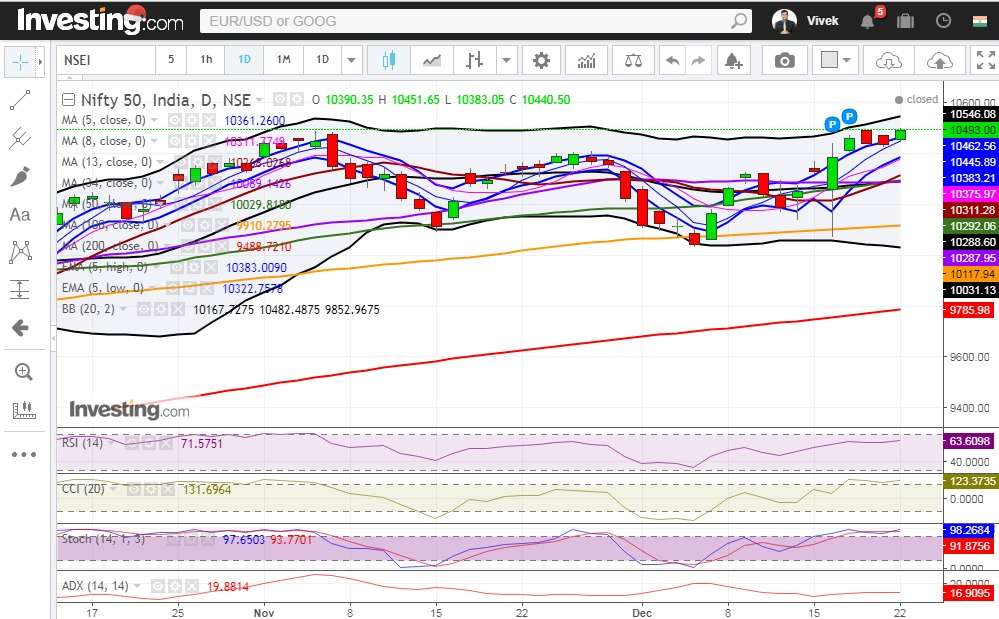
Figure: Nifty Daily Chart
Weekly Technical:
In the weekly chart, Nifty has closed above 5 Day High-Low band. The election result on Monday triggered fresh breakout in Nifty and could take the index to newer highs in the coming weeks.
Weekly Stochastic is in the overbought zone but RSI and CCI are in the normal zone but very close to the upper bound suggesting bullish to neutral view in the weekly timeframe.
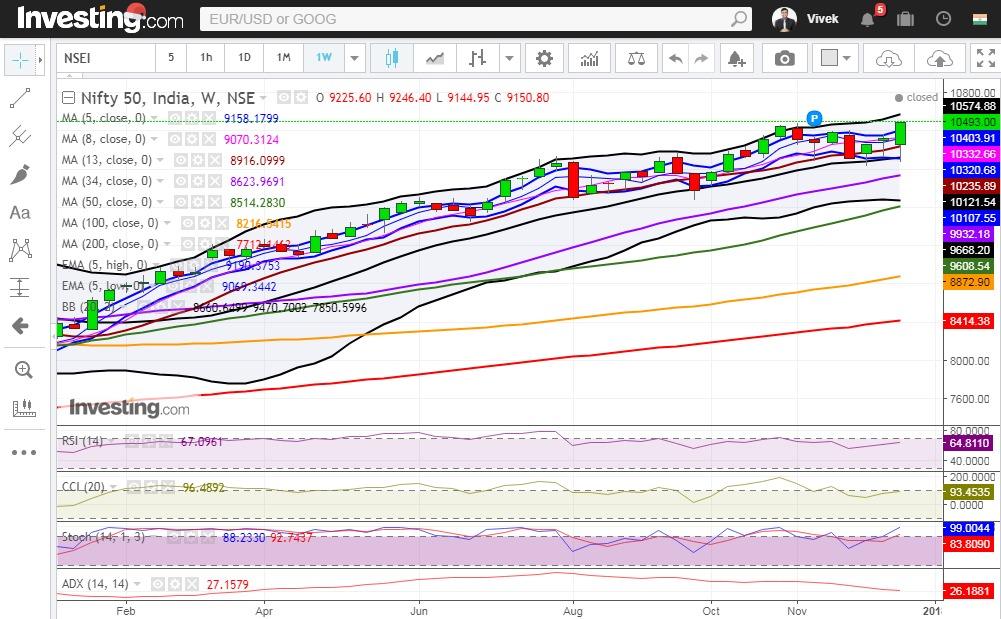
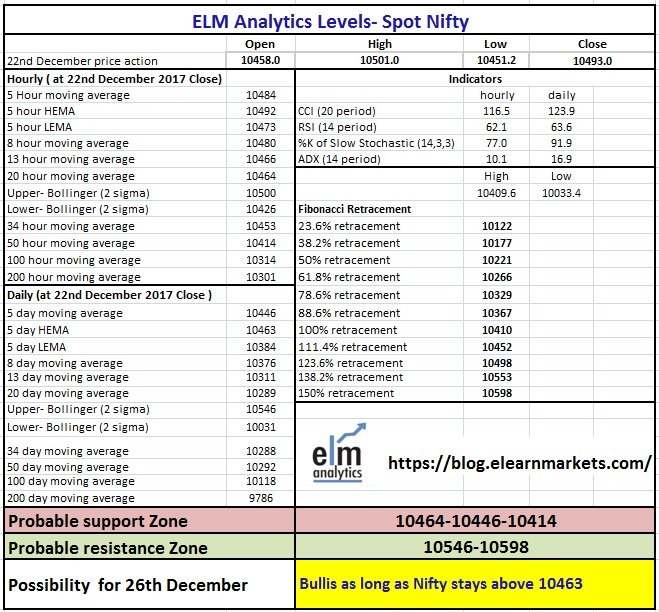
Figure: Nifty Tech Table
Figure: Nifty Weekly Chart
Watch the video below to know how to interpret the above table:
