Nifty added more than 1 percent in the week ended December 13 amid weak domestic data but positive global cues pushed the indices near the all-time highs. The big gains however came from Midcap and Small cap space.
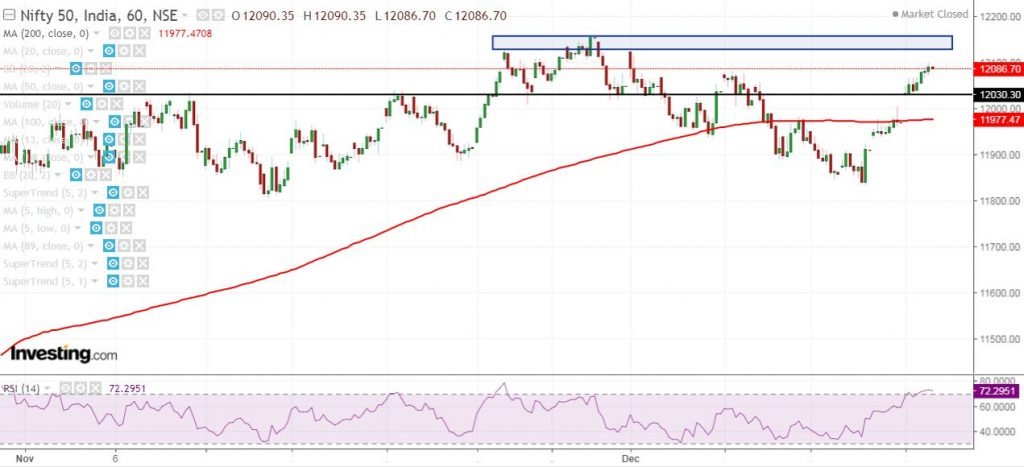
Nifty Hourly
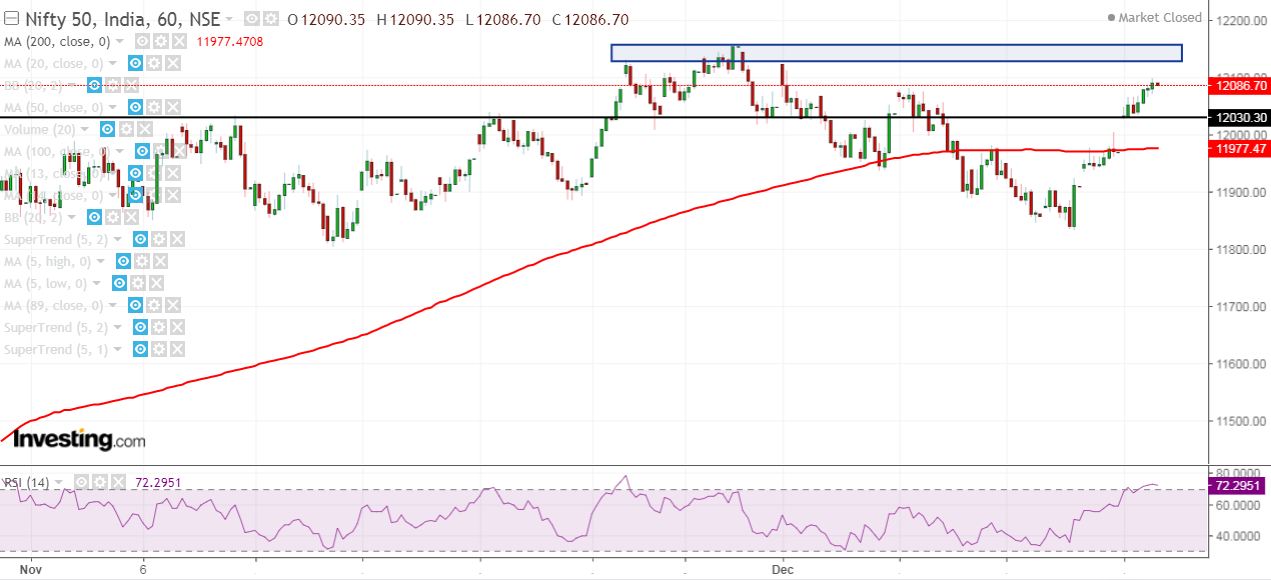
In the hourly chart, the index started the week on a weaker note and faced resistance from 200 MA. On Friday, Nifty broke the resistance with a gap and close almost a day’s high which suggest strength in the index.
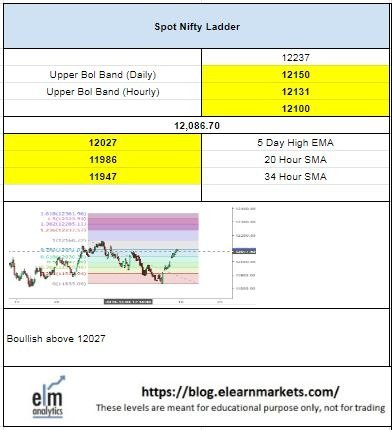
Probable resistance in the short term comes at 12130-12160 and probable support comes at 12030 and next support at 11977. Technical parameters look strong as of now since most technical parameters including RSI, Stochastic and CCI are trading in respective overbought area.
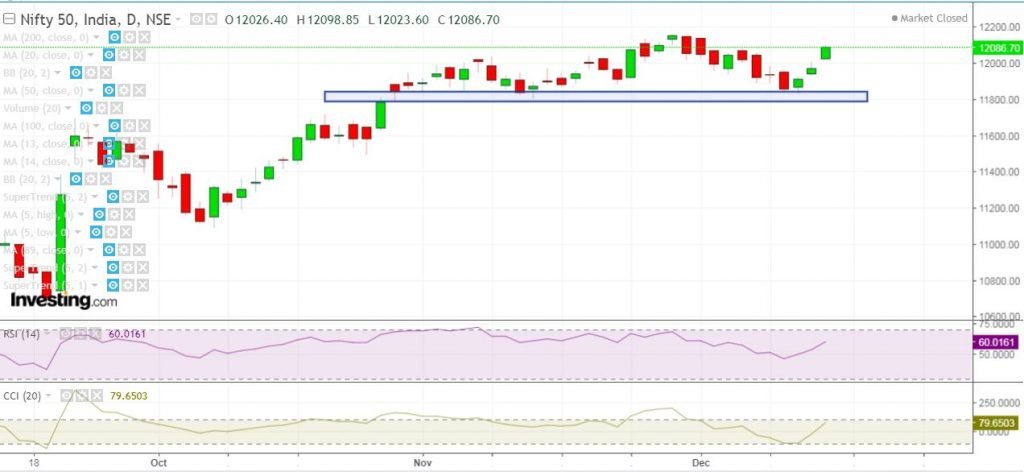
Nifty Daily
Nifty bounced from the support zone in the daily chart and probable resistance as per the previous top comes at 12159; daily close above which may lead to momentum breakout in the index. Technical parameters including RSI and CCI are trading close to the respective upper threshold and suggest strength as of now.
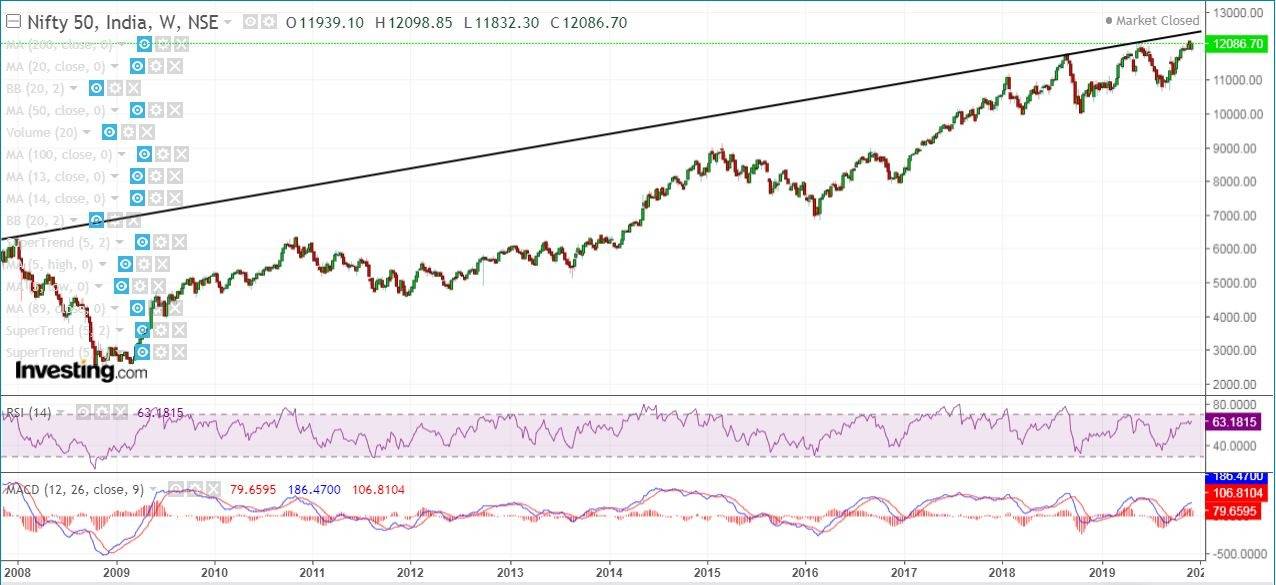
Nifty Weekly
In the weekly chart, Nifty looks strong as per technical parameters and trading very close to the all time high area. Further momentum to be seen only above the swing high till then likely to see short term consolidation in the index.
Probable resistance as per the upper trend line comes at 12400-12450 which is likely to act as a crucial resistance as of now. Breakout above 12500 may lead to steep move in the index. Probable support comes at 11900-11950 in the weekly chart.
Nifty Daily Chart




Your information is very attractive and very positive thank you very much.
Hi,
Thank you for your feedback.
Keep Reading!
Here the Information available is good and beneficial for traders and investors those who are interested in investing their money in share market.
Hi,
Thank you for your feedback.
Keep Reading!