Nifty started the week on a weaker note and witnessed sharp selloff from the long term monthly resistance. Overall the index is likely to stay weak until it stays below 12400-12450. However, there was a short term bounce in the second half of the week from 50 Day SMA ahead of Union Budget.
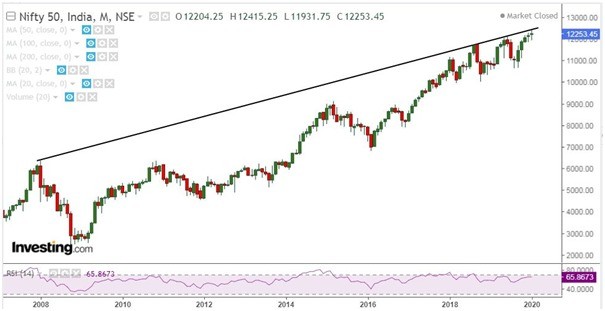
On the other hand, there was an out performance from Midcap and Small cap despite the International Monetary Fund’s (IMF) below 5% India GDP forecast for 2019-20.
Nifty Hourly
In the hourly chart, Nifty witnessed short term rally after it broke resistance zone of 12220-12235. Next crucial resistance in the near term comes at 12290-12300 which is the convergence of 61.8% Fib retracement and hourly resistance.
Technical parameters look positive as of now since most of the parameters including Stochastic and CCI are trading in a overbought zone while RSI is trading close to the over bought zone. Probable support in the short term comes at 12220-12235 as of now. Break either side of the range 12220-12300 may trigger fresh momentum in the stock.
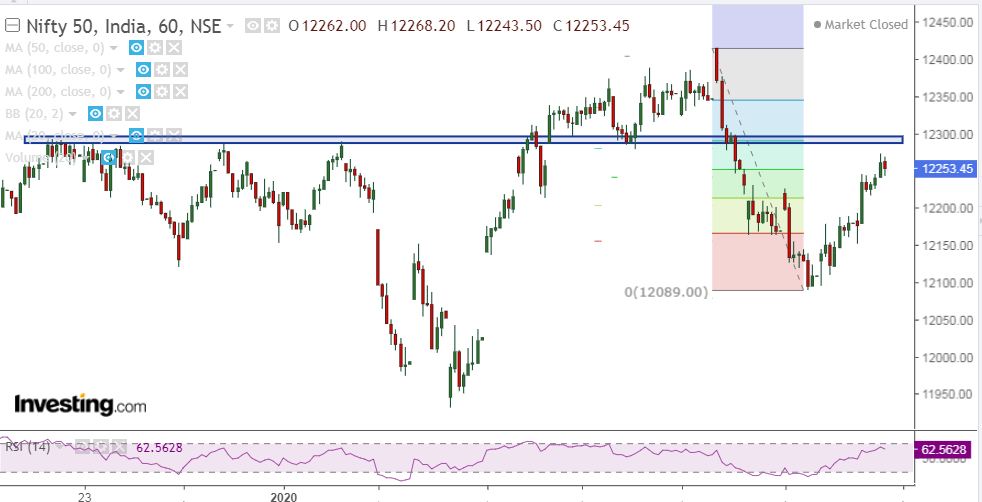
Nifty Hourly chart
Nifty Daily
Nifty witnessed bounce from 50 Day SMA after if faced resistance from the long term resistance. In the near term, 12090-12120 zone likely to act as a probable support area; break below which may trigger further weakness in the index.
Technical parameters including RSI, Stochastic and CCI looks neutral as of now since most of the technical parameters are trading in the normal zone. Probable support in the daily chart comes at 11750 and probable resistance at 12300 as of now.
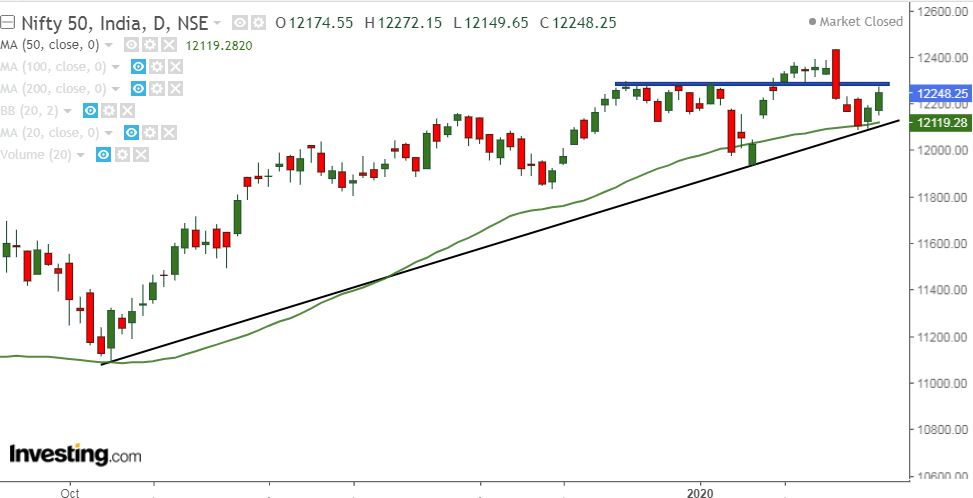
Nifty Daily chart
Nifty Weekly
In the weekly chart, Nifty faced resistance from the upper trend line and formation of bearish engulfing candle at the top is not a very positive sign for the bulls. Likely to stay weak in the medium term until the recent swing high is not violated.
Probable resistance as per the upper trend line comes at 12400-12450 which is likely to act as a crucial resistance as of now. Breakout above 12500 may lead to steep move in the index. Probable support comes at 11900-11950 in the weekly chart.
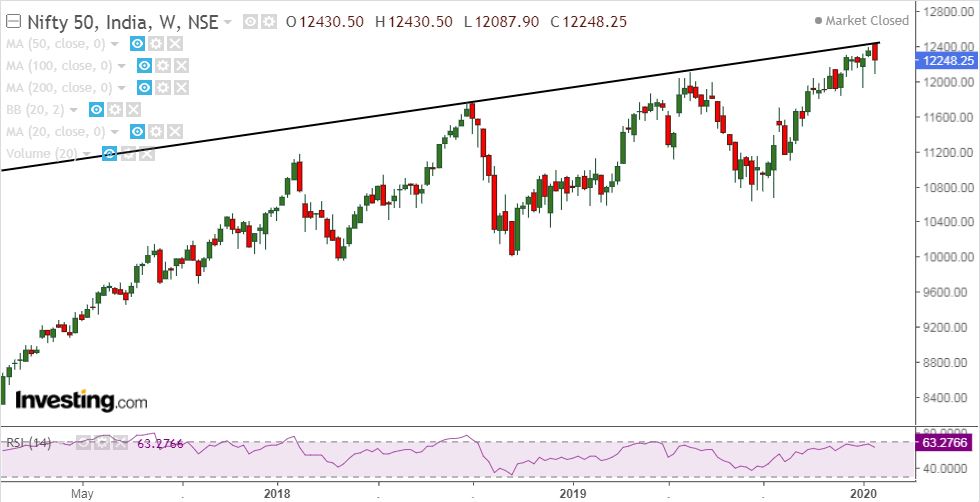
Nifty Weekly chart
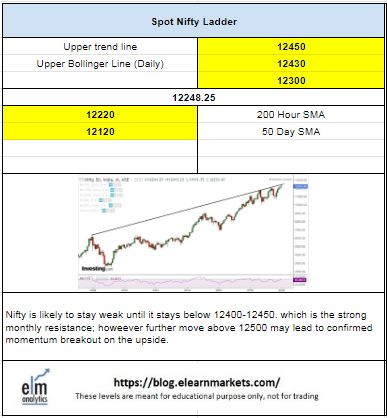
Nifty Tech Table


Your analysis is great