Elearnmarkets - Financial Market Learning
  • Courses
  • Webinars
  • Stories
  • Language
    • English
    • Hindi
    • Bengali
No Result
View All Result
Get Free Course
  • Basic Finance
  • Derivatives
    • Futures
    • Options
  • Financial Planning
  • Fundamental Analysis
  • Technical Analysis
  • Mutual Funds
  • Marketshala
  • Miscellaneous
Elearnmarkets - Learn Stock Market, trading, investing for Free
  • Courses
  • Webinars
  • Stories
  • Language
    • English
    • Hindi
    • Bengali
No Result
View All Result
Get Free Course
Elearnmarkets - Learn Stock Market, trading, investing for Free
No Result
View All Result
Home Technical Analysis Market Analysis
Bank Nifty Hourly Chart

Moody’s Upgrade Pushes Up Bank Nifty, Might See Profit Booking

Elearnmarkets by Elearnmarkets
August 1, 2024
in Market Analysis, Market Wrap
Reading Time: 3 mins read
0
58
VIEWS
Share on FacebookShare on XShare on WhatsApp

Bank Nifty opened above its 5 Day High EMA (25613 approx) today . The Index traded in a range of 236 points and closed below its opening price.
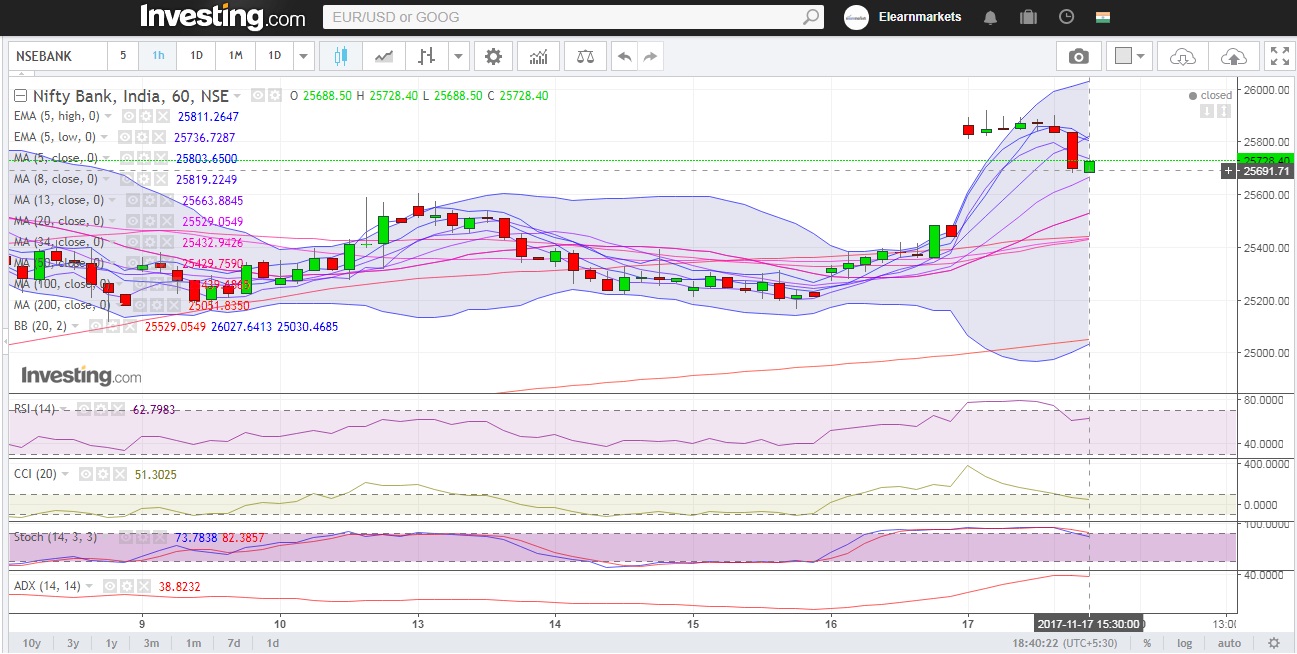
Hourly Technicals:

In the Hourly Chart, Bank Nifty has closed at its 5 hourly low EMA of (25736 approx).The Index is likely to face immediate resistance above its 5 hourly high EMA (25811 approx). Bank Nifty will find its next support around the 13 HMA ( 25664 approx) .

Hourly RSI stands closed near the upper end of the normal range while the CCI is indicating that sentiments are neutral. ADX is indicating that Bank-Nifty might not undergo major volatility yet.

Bank Nifty technical indicate hourly RSI stands closed near the upper end of the normal range while the CCI is indicating that sentiments are neutral. ADX is indicating that Bank-Nifty might not undergo major volatility yet

Figure: Bank-Nifty Hourly Chart

Daily Technicals:

The daily chart indicates that Bank Nifty has closed marginally above its 5 day high EMA (25613 approx). The Index will face immediate resistance around its upper bollinger band (26009 approx). On the downside however, if Bank Nifty breaks and closes below its 5 day high EMA (25613 approx), it could find support at its 8 DMA (25376 approx).

The daily RSI indicator has closed near the higher end of the normal range.The CCI indicator however is indicating that sentiments are positive.The ADX indicates that momentum might remain slack.

Moody’s Upgrade Pushes Up Bank Nifty, Might See Profit Booking 1

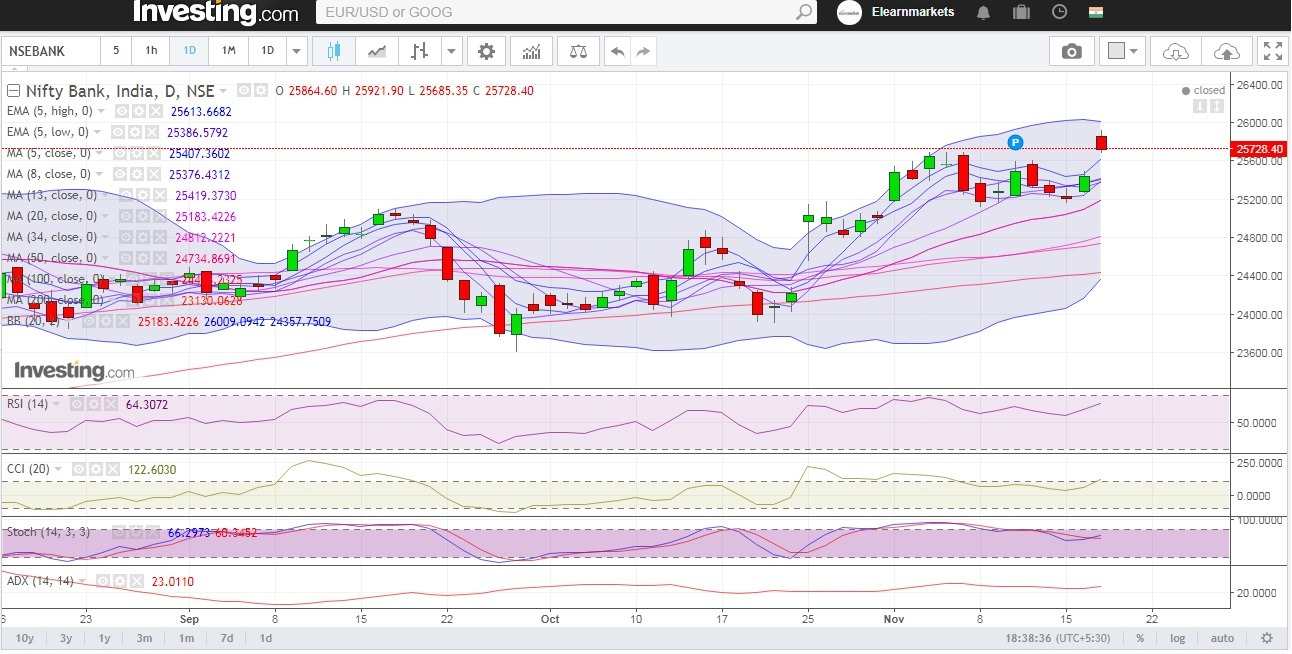
Figure: Bank-Nifty Daily Chart

Weekly Technicals:

The weekly chart indicates that Bank Nifty has closed above the upper end of the weekly bollinger band (25685 approx). The Index will face immediate resistance around the weekly high (25921 approx). On the downside however, if Bank Nifty breaks and closes below its upper bollinger band (25685 approx), it could find support at its e weekly high EMA (25523 approx).

The weekly RSI indicator has closed near the higher end of the normal range.The CCI indicator however is indicating that sentiments are positive.The ADX indicates that momentum might remain slack.

Bank Nifty weekly chart- weekly RSI indicator has closed near the higher end of the normal range. The CCI indicator however is indicating that sentiments are positive. The ADX indicates that momentum might remain slack.

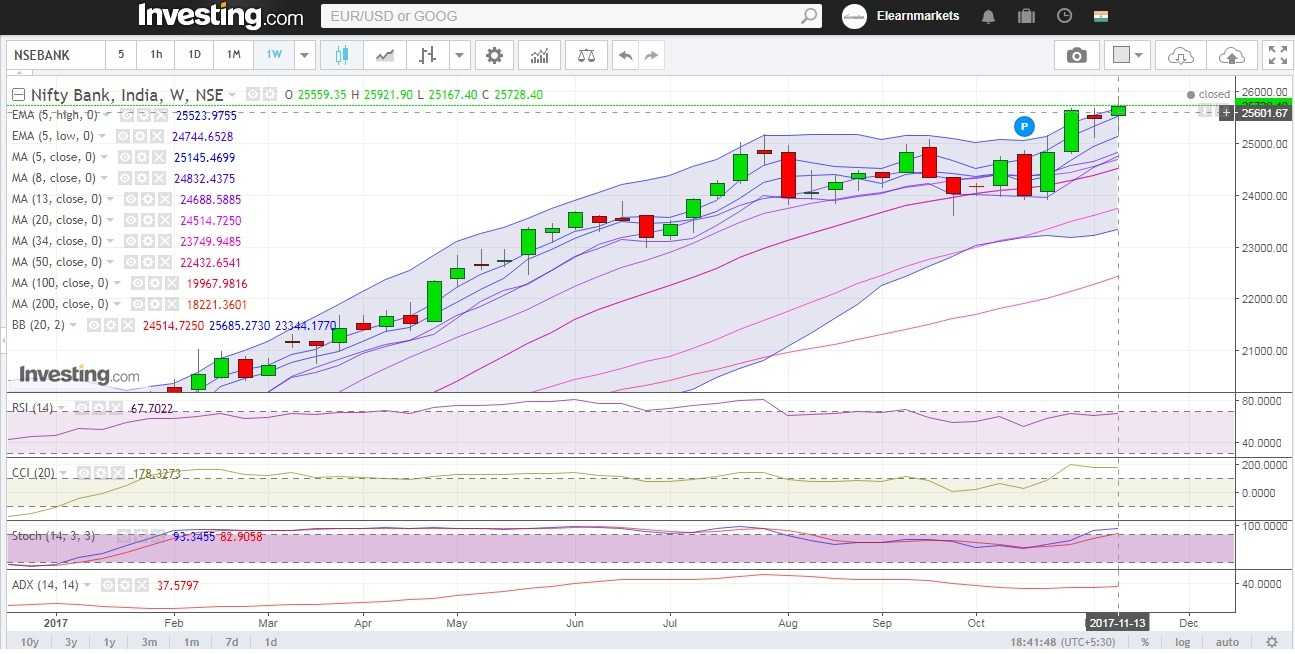
Figure: Bank-Nifty weekly Chart

Bank Nifty Tech Table

Figure: Bank-Nifty Tech Table

Tags: english
ShareTweetSend
Get Kotak Offer Get Kotak Offer Get Kotak Offer
Previous Post

Nifty opened gap up on account of Moody’s upgradation of sovereign rating

Next Post

Range-bound Nifty ends the day with mild gains

Elearnmarkets

Elearnmarkets

Elearnmarkets (ELM) is a complete financial market portal where the market experts have taken the onus to spread financial education. ELM constantly experiments with new education methodologies and technologies to make financial education effective, affordable and accessible to all. You can connect with us on Twitter @elearnmarkets.

Related Posts

Nifty hits 10500 mark and ends at record closing high 2
Market Analysis

Nifty hits 10500 mark and ends at record closing high

August 1, 2024
60
Nifty cheered the exit poll outcomes for Gujarat Assembly Elections 3
Market Analysis

Nifty cheered the exit poll outcomes for Gujarat Assembly Elections

August 1, 2024
73
Nifty reverses gear as D-day of Gujarat election nears 4
Market Analysis

Nifty reverses gear as D-day of Gujarat election nears

August 1, 2024
74
Nifty Hourly Chart
Market Analysis

Nifty likely to consolidate around 10000 before moving higher

August 1, 2024
38

Leave a Reply Cancel reply

Your email address will not be published. Required fields are marked *

Disclaimer

Elearnmarkets (Kredent InfoEdge Pvt. Ltd.) is a SEBI-registered Research Analyst (RA) entity (SEBI Registration No.: INH300007493). The information provided in this article is for educational and informational purposes only and should not be considered as an offer to buy or sell any securities or investment products.

The stocks, securities, and investment instruments mentioned herein are not recommendations under SEBI (Research Analysts) Regulations, 2014. Readers are advised to conduct their own due diligence and seek independent financial advice before making any investment decisions.

Investments in securities markets are subject to market risks. Please read all related documents carefully before investing. Investing in Equity Shares,
Derivatives, Mutual Funds, or other instruments carry inherent risks, including potential loss of capital. Elearnmarkets (Kredent InfoEdge Pvt. Ltd.) does not provide any guarantee or assurance of returns on any investments. Past performance is not indicative of future performance.

Elearnmarkets Logo

Follow Us

Facebook-f X-twitter Instagram Linkedin-in Youtube Telegram

Register on Elearnmarkets

Continue your financial learning by creating your own account on Elearnmarkets.com

Register Free Account

Download App

Playstore logo
Download on app store

Categories

  • Basic Finance
  • Derivatives
  • Financial Planning
  • Fundamental Analysis
  • Technical Analysis
  • Mutual Funds
  • Miscellaneous

Popular On Elearnmarkets

  • Market Superheroes:
  • Vivek Bajaj
  • Chetan Panchamia
  • Ashish Kyal
  • Premal Parekh
  • Abhijit Paul
  • Jegan
  • Sivakumar Jayachadran
  • Jyoti Budhia
  • Vivek Gadodia
  • Vishal Mehta
  • Piyush Chaudhry
  • Santosh Pasi
  • Gomathi Shankar
  • Market Superheroes:
  • Vivek Bajaj
  • Chetan Panchamia
  • Ashish Kyal
  • Premal Parekh
  • Abhijit Paul
  • Jegan
  • Sivakumar Jayachadran
  • Jyoti Budhia
  • Vivek Gadodia
  • Vishal Mehta
  • Piyush Chaudhry
  • Santosh Pasi
  • Gomathi Shankar
  • Courses:​
  • Options Trading
  • Dow Theory
  • Momentum Trading
  • Stock Investing
  • Harmonic Chart Patterns
  • Algo Trading
  • Elliot Wave Theory
  • Advanced Excel
  • Cryptocurrency
  • NSE Certification Course
  • Courses:​
  • Options Trading
  • Dow Theory
  • Momentum Trading
  • Stock Investing
  • Harmonic Chart Patterns
  • Algo Trading
  • Elliot Wave Theory
  • Advanced Excel
  • Cryptocurrency
  • NSE Certification Course
  • Webinars:
  • Bank Nifty Scalping
  • Intraday Trading Strategies
  • Options Trading Strategies
  • Options selling
  • Price Action
  • Relative Strength
  • Tax Planning
  • Options Buying
  • Growth Stocks
  • Portfolio Management
  • Risk Management
  • Renko Charts
  • Crude Oil
  • Traders Psychology
  • Moving Average
  • Multibagger Stocks
  • Free Learning Modules:
  • Intraday Trading
  • Options Scalping
  • Swing Trading
  • Financial Modelling
  • RSI Indicator
  • Bollinger Bands
  • Pricing of Futures
  • Personal Finance
  • Initial Public Offerings (IPO)
  • Value Investing
  • Technical Indicators
  • Candlesticks
  • Chart Patterns
  • Option Greeks
  • ELSS Funds
  • Banking and Insurance
  • Real Estate
  • Gold
  • Book Summaries:
  • Rich Dad Poor Dad
  • Psychology of Money
  • The Intelligent Investor
  • The Richest Man in Babylon
  • Think and Trade Like a Champion
  • Value Investing and Behavioural Finance
  • Trading in the Zone
  • Learn to Earn
  • Book Summaries:
  • Rich Dad Poor Dad
  • Psychology of Money
  • The Intelligent Investor
  • The Richest Man in Babylon
  • Think and Trade Like a Champion
  • Value Investing and Behavioural Finance
  • Trading in the Zone
  • Learn to Earn
  • Tools:
  • CAGR Calculator
  • SIP Calculator
  • eLearnOptions
  • Future Value Calculator
  • Present Value Calculator
  • Atal Pension Yojana
  • Cost of Delay Calculator
  • Become a Crorepati
  • Tools:
  • CAGR Calculator
  • SIP Calculator
  • eLearnOptions
  • Future Value Calculator
  • Present Value Calculator
  • Atal Pension Yojana
  • Cost of Delay Calculator
  • Become a Crorepati

© 2025 Elearnmarkets. All Rights Reserved

  • Visit Elearnmarkets
  • Courses
  • Webinars
  • Financial Guides
  • Get Free Counselling
  • Visit Elearnmarkets
  • Courses
  • Webinars
  • Financial Guides
  • Get Free Counselling

Download Our App

No Result
View All Result
  • Article Categories
    • Basic Finance
    • Derivatives
    • Financial Planning
    • Fundamental Analysis
    • Technical Analysis
    • ETFs & Mutual Funds
    • Marketshala
    • Miscellaneous
  • Language
    • Hindi
    • Bengali
    • English
  • Courses
  • Webinars
  • Stories
Get Free Course

© 2024 Elearnmarkets All Rights Reserved

Infinity Plan
Trading Day 2025