The Stock Market Capitalisation/GDP ratio has been quoted to be the “single best measure of where valuations stand at any given moment” by Warren Buffet in a December 2011 article for Fortune magazine. Gain useful insights like these with our NSE Academy Certified Macroeconomics course on Elearnmarkets. The course develops your analyzing skills and you’ll even be able to predict the effects of implementing new monetary and fiscal policy.
Gross Domestic Product is defined as the value of all final goods and services produced in a country and is used to measure a nation’s economy, while market capitalization is the total value of a company’s outstanding shares calculated as outstanding shares multiplied by the price per share. Market capitalization is essentially a reflection of what the investors want to pay, thus having a large perception value.
The Stock Market Capitalization to GDP Ratio is used to determine whether an overall market is undervalued or overvalued. The ratio can be applied to both specific individual markets as well as the global market to understand possible directions of the markets.
Formula:

It basically tells us what percentage of GDP is represented by the stock market value.
As a thumb rule for investors, the notion is that when the stock moves above 100% of the Market Capitalization -to -GDP Ratio, stocks are said to be expensive and overvalued and when it is near 50%, stocks are assumed to be cheap and undervalued.
The ratio has been successful in the past in predicting peaks in the market correctly and signaling the same but many economists believe that comparing market cap to a domestic value such as GDP may be fallible for certain markets like the United States which have a significant portion of their earnings outside of their country.
Also with so many significant changes in the nations worldwide like Brexit i.e. Britain’s exit from the European Union(EU), Donald Trump’s surprise win in USA, demonetization, and GST (Goods and Service Tax) in India, relying on any one indicator to deploy or employ money is unsuitable.
There is a broad range of indicators such as Price-to-Earnings, Price-to-Book Value to assist Market Cap-to-GDP ratio in achieving the optimal asset allocation.
One fine example depicting Market cap to GDP ratio’s predictive value is given by the fall of the US market after the dot-com bubble burst when the ratio showed a sign of overvalued market at 153% in the 2000s according to the World Bank.
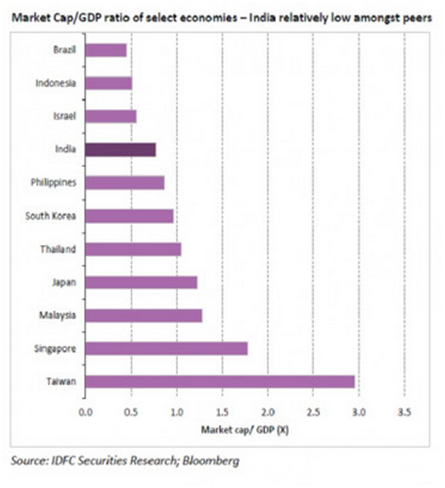
Having said that, India’s current market cap to GDP ratio (as on March 20, 2017) stands at 77% (according to moneycontrol.com) which indicates that there is still scope for the economy to rise and grow.

NIFTY on 20 March 2017 was 9126.85 and today as on, 13 July 2017 closed at 9891.70, an approximate increase of 8.08%. Thus we can expect the current Mcap to GDP ratio to be approximately higher by that percentage since 20 March 2017.
REFERENCE:
Source: moneycontrol.com

Source: siblisresearch.com
As the Indian economy, being an emerging market is still growing compared to other developed economies which are in stagnant or low growth phase, any small increase in the Market cap-to-GDP ratio is not alarming but should be treated as a caution amongst investors. Indian economy is at a pivotal time of formalization of the economy where informal business dealings and sectors will evolve to metamorphose into an organized form providing an impetus to the growth of the organized economy. Investors should understand that the listed companies on the stock exchange form a part of this formal segment of the economy. The formalization of the economy is being achieved by major reforms by the government that include demonetization and implementation of the destination-based tax, GST.
Due to the volatility and uncertainty of the current India economy, the investors must focus on Market Cap to forward GDP, rather than current GDP. Prediction of Indian economy’s GDP being less than 7 percent as an aftermath effect of demonetization was proved wrong in the October-December quarter. It was during this period when the Central Statistics Organisation CSO) announced that India was growing at a healthy GDP rate of 7% and further pegged its advance GDP growth estimate for 2017 at 7.1 percent.
As published by Live Mint E-paper on April 06,2017: Motilal Oswal Securities Ltd. made estimates for the Market capitalization to GDP ratio for 2017 to be 80%. This measure is above the long-term average of 78% calculated from Financial Years 2006 to 2016. The Motilal Oswal report also claimed India’s share in the world market cap to be 0.2% greater than its own long-term average of 2.4%. India also beat the world’s increase in market capitalization by 17%.





What will be the future of mcap in Jan 2018?
Is it the right point to by mcap?
Hello.
The total market capitalisation for all stocks listed on the BSE is Rs. 147.48 trillion as on 29th November 2017. India’s nominal GDP is Rs 148.09 trillion. This gives us a market capitalisation to GDP ratio of around 99%.
As you can see, the ratio has increased sharply since March. No one indicator should be used on a stand-alone basis but yes this gives you a vague idea of how fast our Indian market is booming.
kindly provide from where can I get data of MCAP and GDP day by day ??
Hello Hitul
Firstly, I’d like to inform you that Mcap-GDP ratio should be tracked on a monthly basis and not daily as the daily data will be very volatile and unreliable. Nevertheless, you can get the accurate data (daily/monthly) of the ratio from a paid software called Bloomberg. Even the articles published by Bloomberg quint on the internet, now and then, provide you with accurate values.
what is the future of bitcoin in jan 2018?
Hello.
That prediction is something nobody can make and we are an educational institute. We teach financial concepts and do not make any predictions or give any advice to trade or invest.