Elearnmarkets - Financial Market Learning
  • Courses
  • Webinars
  • Stories
  • Language
    • English
    • Hindi
    • Bengali
No Result
View All Result
Get Free Course
  • Basic Finance
  • Derivatives
    • Futures
    • Options
  • Financial Planning
  • Fundamental Analysis
  • Technical Analysis
  • Mutual Funds
  • Marketshala
  • Miscellaneous
Elearnmarkets - Learn Stock Market, trading, investing for Free
  • Courses
  • Webinars
  • Stories
  • Language
    • English
    • Hindi
    • Bengali
No Result
View All Result
Get Free Course
Elearnmarkets - Learn Stock Market, trading, investing for Free
No Result
View All Result
Home Basic Finance
Market Mood Index

What is Market Mood Index? Analysis and Strategy

Vivek Bajaj by Vivek Bajaj
February 25, 2025
in Basic Finance
Reading Time: 8 mins read
0
2.7k
VIEWS
Share on FacebookShare on XShare on WhatsApp

The Market Mood Index (MMI) is an indicator of the dominant emotions in the stock market. 

MMI assists in gaining insight into the psychological conditions of market participants by analyzing measurements and data points.

This indicator acts as a contrary indicator. Extreme fear and extreme greed are among the emotions represented in the MMI index. 

Extreme fear on the MMI shows a high degree of pessimism among investors, suggesting a possible asset price rise. 

On the other hand, if the MMI shows strong greed, it suggests that investors are bearish, which may reduce asset prices.

By monitoring the MMI, you can obtain important insights into market sentiment and improve the decision-making process regarding your investing strategy.

Table of Contents

  • How to Interpret the Market Mood Index?
  • Factors Affecting the Market Mood Index (MMI)
    • 1. Momentum
    • 2. Market Volatility
    • 3. Investor Behaviour Patterns
    • 4. Price Strength
  • What are the Zones of the Market Mood Index?
  • What are the Benefits of Using the Market Mood Index?
    • Risk Management
    • Informed Decision-Making
    • Simple and Easy to Use
  • Frequently Asked Questions (FAQs)
    • What is the market mood index?
    • How do you calculate the market mood index?
    • What is the fear and greed index?
  • Conclusion

How to Interpret the Market Mood Index?

An indicator that will assist traders in understanding the general sentiment of the market is the Market Mood Index. 

Additionally, this is shown as a number value between 0 and 100. 

What is the market mood index for today, then? 

What is Market Mood Index? Analysis and Strategy 1

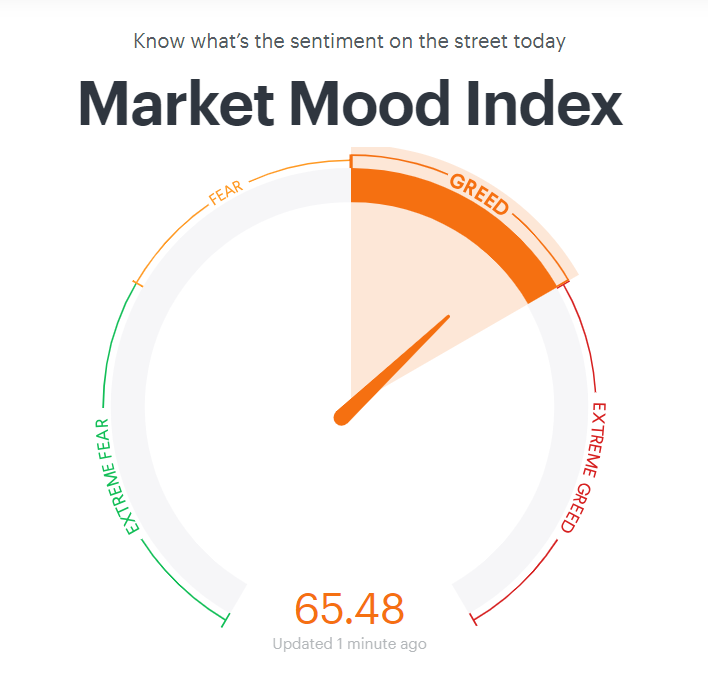
The market is neutral if it is 50; if it is less than 50, there is a bullish sentiment.  In addition, the market is displaying bearish sentiment when the indicator is above 50.

Factors Affecting the Market Mood Index (MMI)

Here are the Factors affecting the Market Mood Index (MMI)-

1. Momentum

Momentum is determined by dividing the difference between the Nifty 50’s 30-day and 90-day exponential moving averages (EMAs) by the 90-day moving average. An uptrend is indicated by a positive momentum value, whilst a decline is shown by a negative value.

2. Market Volatility

The implied volatility of one-month Nifty 50 options is represented by the India VIX index, which is used to assess volatility. The difference in the implied volatilities (IV) of the Nifty 50’s out-of-the-money (OTM) put, and call options are used to compute skew. 

When the VIX is high, it means that market participants are anticipating more volatility and risk. Although volatility indicates the anticipated movement of the market, skew indicates the direction of this movement. There is a greater likelihood of downward movement with a higher-than-average skew value and vice versa.

3. Investor Behaviour Patterns

International institutional investors, or FIIs, have a big say in how the market feels. The net open interest of FIIs in Index Futures on the NSE is monitored by the MMI. Above-average readings in this indicator indicate that FIIs have bullish opinions about the market.

4. Price Strength

By deducting the percentage of stocks close to their 52-week high from the percentage of stocks close to their 52-week low, one can calculate the price strength. The net proportion of equities that are close to their 52-week high is given by this computation. Stronger price strength in the market is indicated by higher values.

What are the Zones of the Market Mood Index?

Below are the zones of MMI-

  • Fear (30-50): Suggests market caution amid volatility, requiring careful investment decisions.
  • Extreme Fear (Below 30): Indicates market pessimism, potentially signalling buying opportunities.
  • Greed (50-70): Indicates bullish sentiment and potential overvaluation, prompting cautious optimism.
  • Extreme Greed (Above 70): May signal market overheating, advising prudent portfolio adjustments.

What are the Benefits of Using the Market Mood Index?

Let us discuss the Benefits of Using the Market Mood Index-
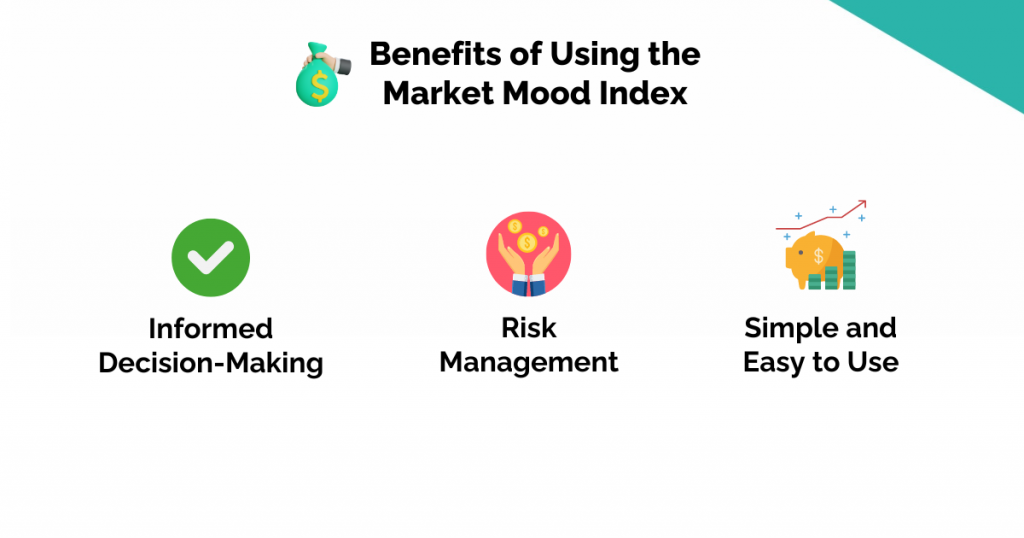
What is Market Mood Index? Analysis and Strategy 2

Risk Management

Investors can adjust their risk exposure and position size in response to the current market sentiment by keeping an eye on the market mood index.

Informed Decision-Making

By identifying potential points of entry and departure in the market, buyers can take advantage of favorable market conditions with the use of the market mood measure.

Simple and Easy to Use

Today’s market mood index might assist investors who are willing to take a risk in identifying potential buy chances during periods of extreme market negativity or selling opportunities during periods of extreme market optimism.

You can visit StockEdge for know much more about market sentiment

Frequently Asked Questions (FAQs)

What is the market mood index?

An indicator that will assist traders in understanding the general sentiment of the market is the Market Mood Index.

How do you calculate the market mood index?

It is calculated by dividing the difference between the Nifty 50’s 30D and 90D exponential moving averages by the 90D moving average. An upward trend is indicated by a positive value, and vice versa.

What is the fear and greed index?

The index is based on a range of 0 to 100, where 0 corresponds to extreme fear, 50 to neutrality, and 100 to extreme greed.

Conclusion

Although the Market Mood Index (MMI) is a useful instrument for gauging sentiment in the market, one should proceed cautiously when interpreting its prediction accuracy. It is important to take into account its limitations and utilize it in conjunction with other indications for informed decision-making, even if it can help with investment decisions and offer insights into prevailing emotions. Because the MMI is constructed using variables including FII activity, volatility, momentum, and market breadth, it provides investors with a thorough picture of market sentiment and the ability to make wise decisions based on the mood of the market.

Tags: basicenglishinvestment basics
ShareTweetSend
Get Kotak Offer Get Kotak Offer Get Kotak Offer
Previous Post

The Role of Liquidity in Crypto Exchange Trading: Why It Matters and How to Assess It

Next Post

A Tiny Country With The Highest GDP per Capita: Luxembourg

Vivek Bajaj

Vivek Bajaj

Mr. Vivek Bajaj has over 18 years of trading experience in equities, options, currencies, and commodity markets. He is the co-founder of Stockedge and Elearnmarkets and is passionate about data, analytics, and technology. He serves on various exchange committees and has played a significant role in the evolution of India's derivative market. He has been a speaker at various colleges and higher institutions, including IIT and IIMs.

Related Posts

How is standard deviation used in mutual fund
ETFs & Mutual Funds

How is Standard Deviation Used in Mutual Fund

April 22, 2025
353
Ways to Make Trading More Transparent
Cryptocurrency

Under the Crypto Hood: 5 Ways to Make Trading More Transparent

May 5, 2025
79
options trading books
Basic Finance

Top 5 Options Trading Books for Beginners

March 19, 2025
856
The Rise of Meme Coins Like Trump Coin and Why They May Be a Good Investment 3
Cryptocurrency

The Rise of Meme Coins Like Trump Coin and Why They May Be a Good Investment

February 26, 2025
166

Leave a Reply Cancel reply

Your email address will not be published. Required fields are marked *

Disclaimer

Elearnmarkets (Kredent InfoEdge Pvt. Ltd.) is a SEBI-registered Research Analyst (RA) entity (SEBI Registration No.: INH300007493). The information provided in this article is for educational and informational purposes only and should not be considered as an offer to buy or sell any securities or investment products.

The stocks, securities, and investment instruments mentioned herein are not recommendations under SEBI (Research Analysts) Regulations, 2014. Readers are advised to conduct their own due diligence and seek independent financial advice before making any investment decisions.

Investments in securities markets are subject to market risks. Please read all related documents carefully before investing. Investing in Equity Shares,
Derivatives, Mutual Funds, or other instruments carry inherent risks, including potential loss of capital. Elearnmarkets (Kredent InfoEdge Pvt. Ltd.) does not provide any guarantee or assurance of returns on any investments. Past performance is not indicative of future performance.

Elearnmarkets Logo

Follow Us

Facebook-f X-twitter Instagram Linkedin-in Youtube Telegram

Register on Elearnmarkets

Continue your financial learning by creating your own account on Elearnmarkets.com

Register Free Account

Download App

Playstore logo
Download on app store

Categories

  • Basic Finance
  • Derivatives
  • Financial Planning
  • Fundamental Analysis
  • Technical Analysis
  • Mutual Funds
  • Miscellaneous

Popular On Elearnmarkets

  • Market Superheroes:
  • Vivek Bajaj
  • Chetan Panchamia
  • Ashish Kyal
  • Premal Parekh
  • Abhijit Paul
  • Jegan
  • Sivakumar Jayachadran
  • Jyoti Budhia
  • Vivek Gadodia
  • Vishal Mehta
  • Piyush Chaudhry
  • Santosh Pasi
  • Gomathi Shankar
  • Market Superheroes:
  • Vivek Bajaj
  • Chetan Panchamia
  • Ashish Kyal
  • Premal Parekh
  • Abhijit Paul
  • Jegan
  • Sivakumar Jayachadran
  • Jyoti Budhia
  • Vivek Gadodia
  • Vishal Mehta
  • Piyush Chaudhry
  • Santosh Pasi
  • Gomathi Shankar
  • Courses:​
  • Options Trading
  • Dow Theory
  • Momentum Trading
  • Stock Investing
  • Harmonic Chart Patterns
  • Algo Trading
  • Elliot Wave Theory
  • Advanced Excel
  • Cryptocurrency
  • NSE Certification Course
  • Courses:​
  • Options Trading
  • Dow Theory
  • Momentum Trading
  • Stock Investing
  • Harmonic Chart Patterns
  • Algo Trading
  • Elliot Wave Theory
  • Advanced Excel
  • Cryptocurrency
  • NSE Certification Course
  • Webinars:
  • Bank Nifty Scalping
  • Intraday Trading Strategies
  • Options Trading Strategies
  • Options selling
  • Price Action
  • Relative Strength
  • Tax Planning
  • Options Buying
  • Growth Stocks
  • Portfolio Management
  • Risk Management
  • Renko Charts
  • Crude Oil
  • Traders Psychology
  • Moving Average
  • Multibagger Stocks
  • Free Learning Modules:
  • Intraday Trading
  • Options Scalping
  • Swing Trading
  • Financial Modelling
  • RSI Indicator
  • Bollinger Bands
  • Pricing of Futures
  • Personal Finance
  • Initial Public Offerings (IPO)
  • Value Investing
  • Technical Indicators
  • Candlesticks
  • Chart Patterns
  • Option Greeks
  • ELSS Funds
  • Banking and Insurance
  • Real Estate
  • Gold
  • Book Summaries:
  • Rich Dad Poor Dad
  • Psychology of Money
  • The Intelligent Investor
  • The Richest Man in Babylon
  • Think and Trade Like a Champion
  • Value Investing and Behavioural Finance
  • Trading in the Zone
  • Learn to Earn
  • Book Summaries:
  • Rich Dad Poor Dad
  • Psychology of Money
  • The Intelligent Investor
  • The Richest Man in Babylon
  • Think and Trade Like a Champion
  • Value Investing and Behavioural Finance
  • Trading in the Zone
  • Learn to Earn
  • Tools:
  • CAGR Calculator
  • SIP Calculator
  • eLearnOptions
  • Future Value Calculator
  • Present Value Calculator
  • Atal Pension Yojana
  • Cost of Delay Calculator
  • Become a Crorepati
  • Tools:
  • CAGR Calculator
  • SIP Calculator
  • eLearnOptions
  • Future Value Calculator
  • Present Value Calculator
  • Atal Pension Yojana
  • Cost of Delay Calculator
  • Become a Crorepati

© 2025 Elearnmarkets. All Rights Reserved

  • Visit Elearnmarkets
  • Courses
  • Webinars
  • Financial Guides
  • Get Free Counselling
  • Visit Elearnmarkets
  • Courses
  • Webinars
  • Financial Guides
  • Get Free Counselling

Download Our App

No Result
View All Result
  • Article Categories
    • Basic Finance
    • Derivatives
    • Financial Planning
    • Fundamental Analysis
    • Technical Analysis
    • ETFs & Mutual Funds
    • Marketshala
    • Miscellaneous
  • Language
    • Hindi
    • Bengali
    • English
  • Courses
  • Webinars
  • Stories
Get Free Course

© 2024 Elearnmarkets All Rights Reserved

Guide to Basics of Stock Investing
Learn to interpret the financial performance and health of a company.
Download Guide For FREE
Trading Mentorship Program