Elearnmarkets - Financial Market Learning
  • Categories
    • Basic Finance
    • Derivatives
      • Futures
      • Options
    • Financial Planning
    • Fundamental Analysis
    • Technical Analysis
    • Marketshala
    • Miscellaneous
  • Language
    • English
    • Hindi
    • Bengali
No Result
View All Result
  • Courses
  • Webinars
  • Stories
Elearnmarkets - Learn Stock Market, trading, investing for Free
No Result
View All Result
Home Marketshala
Intraday Share Trading - Smart Method for Trading in Stocks 1

Intraday Share Trading – Smart Method for Trading in Stocks

Elearnmarkets by Elearnmarkets
September 6, 2023
in Marketshala
Reading Time: 6 mins read
6
14.4k
VIEWS
Share on FacebookShare on XShare on WhatsApp

Listen to this:

In our previous Marketshala series blog, we had discussed how to learn Intraday Trading in 30 minutes in which we had discussed about the Golden Rules of Intraday share Trading.

In another interesting session as part of the highly popular MarketShala series conducted by Elearnmarkets, Mr. Vivek Bajaj, Co-founder Elearnmarkets, and Mr. Chetan Panchamia a prolific intraday trader and trainer with many years of experience came together to decode the ACRR (Action, Confirmation, Retest, Reconfirmation ) method of intraday trading that really works when you do intraday trading.

Table Of Contents
  1. ACRR Method of Intraday Share Trading
    • Step 1: Action
    • Step 2: Confirmation
    • Step 3: Retest
    • Learn in detail about Intraday Trading in just 2 hours by Market Experts
    • Step 4: Reconfirmation
  2. Example- Reliance Industries Ltd.:

Here is a short discussion of this session. If you want to get a practical understanding of the ACRR method of intraday share trading, watch the full video at the end of this blog.

ACRR Method of Intraday Share Trading

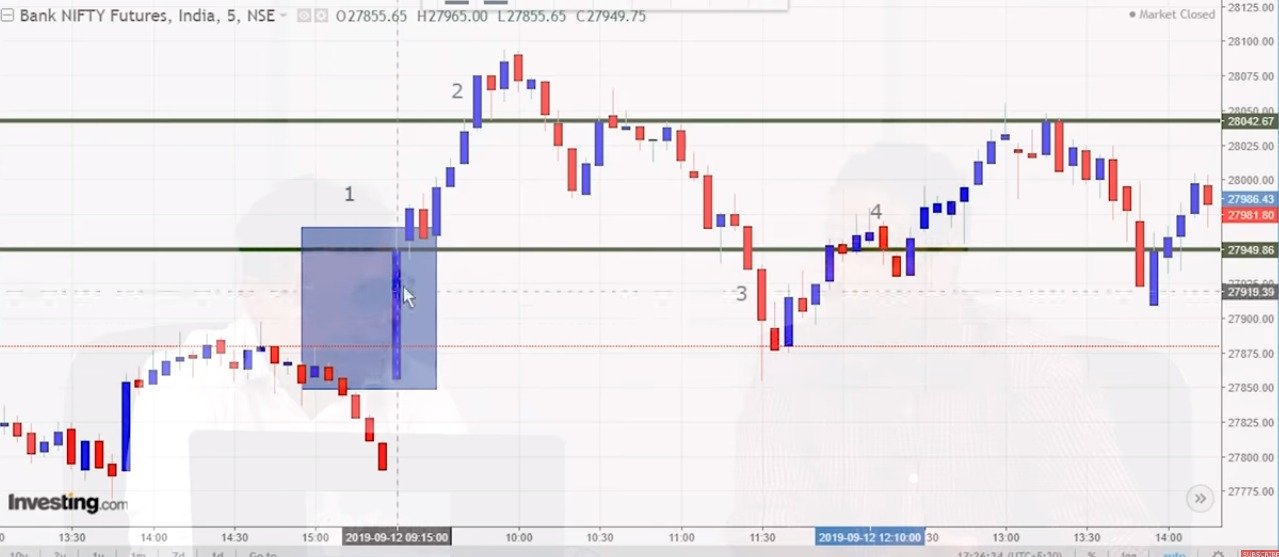
To understand the steps of the ACRR Method of Intraday Trading let us take an example of 5 minutes candlestick chart of Bank Nifty:

Intraday Share Trading - Smart Method for Trading in Stocks 2

Step 1: Action

When doing intraday share trading the first 5-15 minutes is very important to analyze whether the buying or selling based action is taking place in the stock.

For this, we need to analyze the 5 minutes candlestick chart.

We can see in the first 5 minutes candlestick chart of Bank Nifty that a big bullish candle is formed that is indicating buy-side action.

If a big bearish candle is formed in the first 5 minutes candlestick then it indicates sell-based action.

At the closing price of the first 5 minutes candlestick, we should draw a line as shown in the chart which will help us to determine the further steps.

RelatedPosts

The Smart Way to become Option Chain Expert in 30 min 5

The Smart Way to become Option Chain Expert in 30 min

September 4, 2023
81.7k
2 Steps that help in identifying Turnaround Stocks for Big Profits 6

2 Steps that help in identifying Turnaround Stocks for Big Profits

August 11, 2022
7.8k
Should Retail Traders trade in Futures or Options? 7

Should Retail Traders trade in Futures or Options?

August 21, 2023
4.4k

Now let us come to the next step of the ACRR method i.e Confirmation.

Step 2: Confirmation

If the market sustains for the next 15-20 minutes after the closing of the first 5 minutes candlestick on the bullish side, then it indicates confirmation of the buy-side action.

This means that the buyers were successful in moving the prices above after the closing of 5 minutes candlestick.

This is shown as 2 on the above 5 minutes candlestick chart of Bank Nifty.

Step 3: Retest

If the prices of the stock sustain for a maximum of 3 candles below the line that we had drawn by taking the closing price of the first 5 minutes candle then the prices retest.

This means that the buyers who were active in the first 5 minutes candle may push up the prices again at this level.

This is shown as 3 on the above 5 minutes candlestick chart of Bank Nifty.

Learn in detail about Intraday Trading in just 2 hours by Market Experts

If the low gets broken after the 3 candles or even with 1 candle then it means that the buying power of the buyers has reduced and the prices may fall.

Step 4: Reconfirmation

If the prices sustain and move above the line then it reconfirms the buying side action that took place in the first 5 minutes of candlestick.

This is shown as 4 on the above 5 minutes candlestick chart of Bank Nifty.

We can buy at the candlestick formed above the line after the prices reconfirm and sustain.

Stop-loss can be placed at the recent low of the candle. After entering the management of the trades is important.

Example- Reliance Industries Ltd.:

Let us take another example of 5 minutes candlestick chart of Reliance Industries Ltd. to understand this method:

ACRR Method of Intraday Share Trading

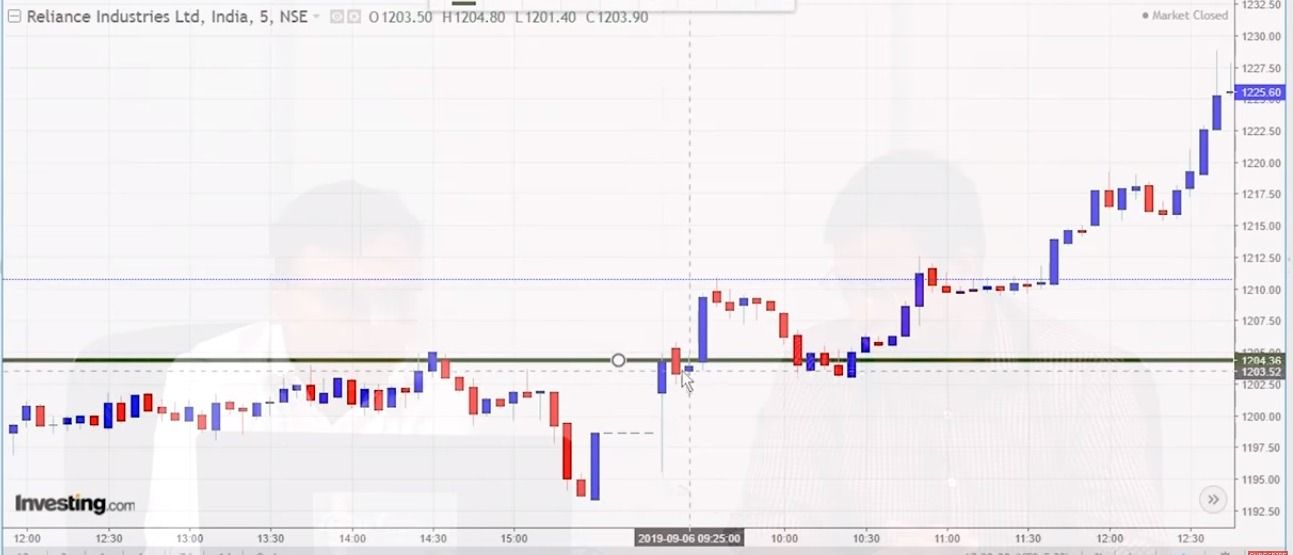
Step 1 – We can see that a bullish reversal candlestick is formed in the first 5 minutes which indicates buying side action.

Step 2– The prices rise after the closing of the first 5 minutes candle i.e confirmation taking place.

Step 3 – The prices fell but sustain the line which we had drawn at the closing of the first 5 minutes candle i.e Retest.

Step 4 – The prices sustain and rise above the line i.e Reconfirmation.Intraday Share Trading - Smart Method for Trading in Stocks 3

This method does not validate when the pattern is not fully formed.

For example, from the below 5 minutes chart of Reliance Industries Ltd. we can see that a big bullish candle is formed in the first 5 minutes candle.

But the prices did not sustain after the closing of the first 5 minutes bullish candle and step 2 i.e. Confirmation did not take place.

Intraday Share Trading - Smart Method for Trading in Stocks 4

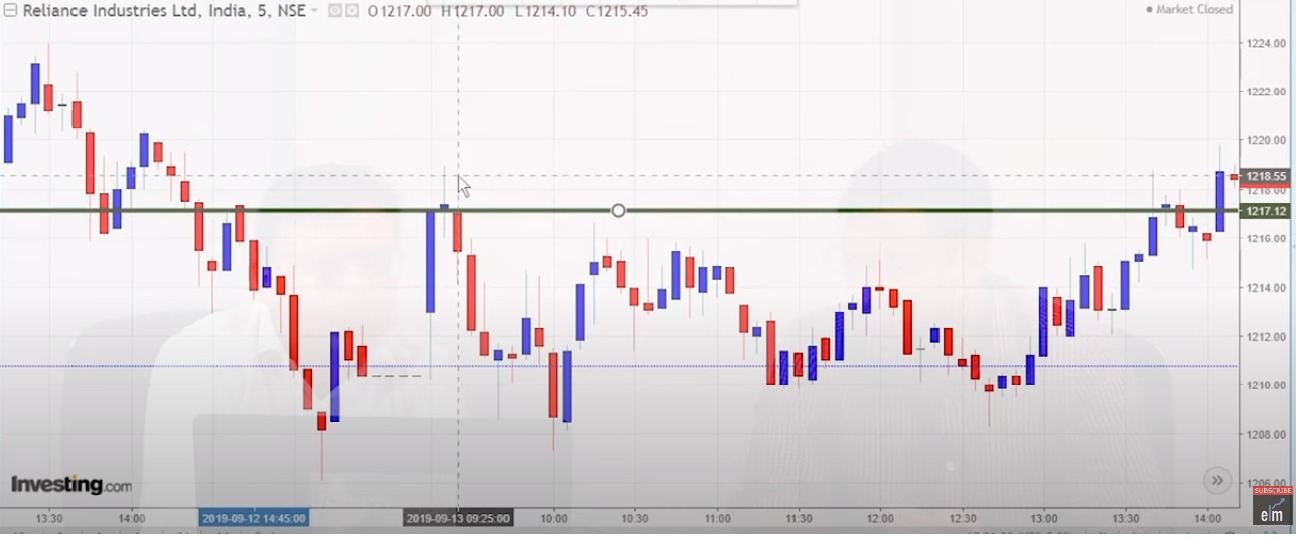
So here the ACRR method of intraday share trading cannot be used.

You can watch the entire video here:

This is a very simple method of intraday share trading that can be used once the formation of the pattern takes place on the 5 minutes candlestick chart as discussed in the video.

This is a very rare pattern but once you have identified this pattern then you can earn a good profit from it.

Remember while doing intraday share trading trade management is also important.

Tags: advanceintraday share tradingintraday trading methodtrading shares
ShareTweetSend
Get Kotak Offer Get Kotak Offer Get Kotak Offer
Previous Post

Buyback of Shares Meaning – Ways, Participation, Pros & Cons

Next Post

Channel Chart Pattern – Formation, Types, and Trading

Elearnmarkets

Elearnmarkets

Elearnmarkets (ELM) is a complete financial market portal where the market experts have taken the onus to spread financial education. ELM constantly experiments with new education methodologies and technologies to make financial education effective, affordable and accessible to all. You can connect with us on Twitter @elearnmarkets.

Related Posts

The Smart Way to become Option Chain Expert in 30 min 8
Marketshala

The Smart Way to become Option Chain Expert in 30 min

September 4, 2023
81.7k
2 Steps that help in identifying Turnaround Stocks for Big Profits 9
Marketshala

2 Steps that help in identifying Turnaround Stocks for Big Profits

August 11, 2022
7.8k
Should Retail Traders trade in Futures or Options? 10
Marketshala

Should Retail Traders trade in Futures or Options?

August 21, 2023
4.4k
How to Exit a Stock in Stock Trading? 11
Marketshala

How to Exit a Stock in Stock Trading?

September 6, 2023
2.7k

Comments 6

  1. Bhaskar says:
    3 years ago

    Was really helpful video as well as the blog .
    Thnx for the knowledge.

    Reply
    • Sakshi Agarwal says:
      3 years ago

      Hi,

      Thank you for Reading!

      Keep Reading!

      Reply
  2. R. Vijaya kumar says:
    3 years ago

    Sir,
    Thank you for this simple and logical way of approach for intraday strategy.

    Reply
    • Sakshi Agarwal says:
      3 years ago

      Hi,

      Thank you for Reading!

      Keep Reading!

      Reply
  3. V sunil kumar says:
    3 years ago

    Very interesting and nice presentation thank you

    Reply
    • Sakshi Agarwal says:
      3 years ago

      Hi,

      Thank you for Reading!

      Keep Reading!

      Reply

Leave a Reply Cancel reply

Your email address will not be published. Required fields are marked *

Elearnmarkets Logo

Follow Us

Facebook-f Twitter Instagram Linkedin-in Youtube Telegram

Register on Elearnmarkets

Continue your financial learning by creating your own account on Elearnmarkets.com

Register Free Account

Download App

Playstore logo
Download on app store

Categories

  • Basic Finance
  • Derivatives
  • Financial Planning
  • Fundamental Analysis
  • Technical Analysis
  • Marketshala
  • Miscellaneous

Popular On Elearnmarkets

  • Market Superheroes:
  • Vivek Bajaj
  • Chetan Panchamia
  • Ashish Kyal
  • Premal Parekh
  • Abhijit Paul
  • Jegan
  • Sivakumar Jayachadran
  • Vishal Malkan
  • Jyoti Budhia
  • Vivek Gadodia
  • Vishal Mehta
  • Piyush Chaudhry
  • Santosh Pasi
  • Gomathi Shankar
  • Market Superheroes:
  • Vivek Bajaj
  • Chetan Panchamia
  • Ashish Kyal
  • Premal Parekh
  • Abhijit Paul
  • Jegan
  • Sivakumar Jayachadran
  • Vishal Malkan
  • Jyoti Budhia
  • Vivek Gadodia
  • Vishal Mehta
  • Piyush Chaudhry
  • Santosh Pasi
  • Gomathi Shankar
  • Courses:​
  • Options Trading
  • Dow Theory
  • Momentum Trading
  • Stock Investing
  • Stock Market for Beginners
  • Harmonic Chart Patterns
  • Algo Trading
  • Elliot Wave Theory
  • Advanced Excel
  • Cryptocurrency
  • NSE Certification Course
  • Courses:​
  • Options Trading
  • Dow Theory
  • Momentum Trading
  • Stock Investing
  • Stock Market for Beginners
  • Harmonic Chart Patterns
  • Algo Trading
  • Elliot Wave Theory
  • Advanced Excel
  • Cryptocurrency
  • NSE Certification Course
  • Webinars:
  • Bank Nifty Scalping
  • Intraday Trading Strategies
  • Options Trading Strategies
  • Options selling
  • Price Action
  • Relative Strength
  • Tax Planning
  • Options Buying
  • Growth Stocks
  • Portfolio Management
  • Relative Strength Index
  • Risk Management
  • Renko Charts
  • Crude Oil
  • Traders Psychology
  • Moving Average
  • Multibagger Stocks
  • Free Learning Modules:
  • Intraday Trading
  • Options Scalping
  • Swing Trading
  • Financial Modelling
  • RSI Indicator
  • Bollinger Bands
  • Pricing of Futures
  • Personal Finance
  • Initial Public Offerings (IPO)
  • Value Investing
  • Technical Indicators
  • Candlesticks
  • Chart Patterns
  • Option Greeks
  • ELSS Funds
  • Banking and Insurance
  • Real Estate
  • Gold
  • Book Summaries:
  • Rich Dad Poor Dad
  • Psychology of Money
  • The Intelligent Investor
  • The Richest Man in Babylon
  • Think and Trade Like a Champion
  • Value Investing and Behavioural Finance
  • Trading in the Zone
  • Learn to Earn
  • Book Summaries:
  • Rich Dad Poor Dad
  • Psychology of Money
  • The Intelligent Investor
  • The Richest Man in Babylon
  • Think and Trade Like a Champion
  • Value Investing and Behavioural Finance
  • Trading in the Zone
  • Learn to Earn
  • Tools:
  • CAGR Calculator
  • SIP Calculator
  • eLearnOptions
  • Future Value Calculator
  • Present Value Calculator
  • Atal Pension Yojana
  • Cost of Delay Calculator
  • Become a Crorepati
  • Tools:
  • CAGR Calculator
  • SIP Calculator
  • eLearnOptions
  • Future Value Calculator
  • Present Value Calculator
  • Atal Pension Yojana
  • Cost of Delay Calculator
  • Become a Crorepati

© 2023 Elearnmarkets. All Rights Reserved

  • Visit Elearnmarkets
  • Courses
  • Webinars
  • Financial Guides
  • Get Free Counselling
  • Visit Elearnmarkets
  • Courses
  • Webinars
  • Financial Guides
  • Get Free Counselling

Get Elearnmarkets App

No Result
View All Result
  • Article Categories
    • Basic Finance
    • Derivatives
    • Financial Planning
    • Fundamental Analysis
    • Technical Analysis
    • Marketshala
    • Miscellaneous
  • Language
    • Hindi
    • Bengali
    • English
  • Courses
  • Webinars
  • Stories

© 2020 Elearnmarkets All Rights Reserved

Guide Book on Investing with ₹ 5000
Learn about the Basics of Investments and Finance in this Ebook.
Download Now