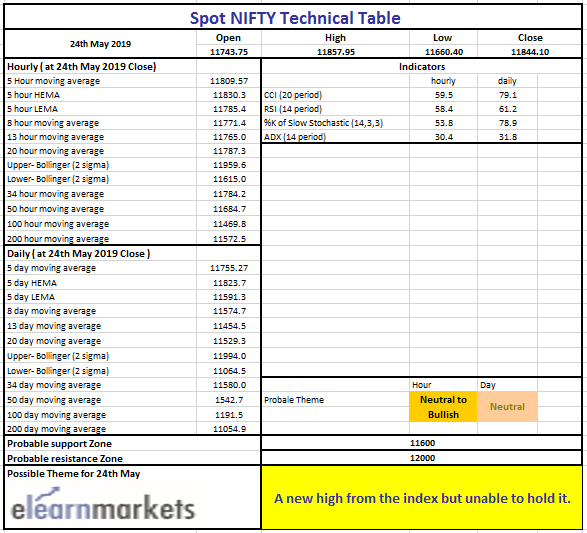
Nifty close 11844.10: A dramatic week comes to an end. At least we know the result of the election and the market has already discounted it. Hopefully, India Vix is also going to come down.
Generally, when the India Vix is so high (above 25 level) Technical and Fundamental analysis do not work so well. So as the Vix comes down, we can expect that the market will be less noisy for the upcoming days.
At present, two possible scenarios might take place.1. Bulls will push the price higher and 2. Bears will take down the price.
Very less chance that the market is going to trade at this level for a long time.
Now let’s analyze the chart and draw what could be the possible levels where the Index might take a breath (for Up move and Down move).
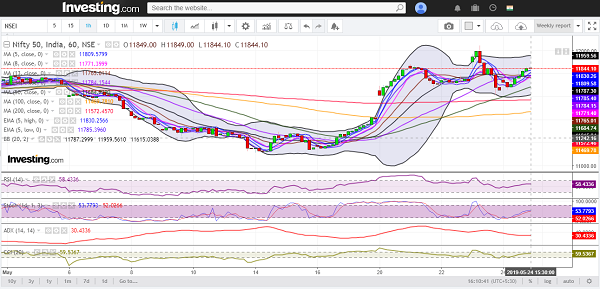
Hourly Technical: On the Hourly chart, price is trading above most of the short and long term Moving Averages. So, as long the MAs stays below the price, the Bulls will rule.
As we know, the most important resistance is at 12000 level and slowly the index heading towards this. As the trend is unfolding the strength is slowly decreasing. So there could be a possible pull back from that level.
On the other side, if the price manages to close above the 12000 level, further up move up to 12200 level might take place (as per the Fib extension.).
Let’s look at the indicators. RSI is above 55, Stochastic is also trading approximately same level, ADX is at 30 but slopping down and the CCI is hovering at its normal level.
So indicators position is normal. In case price slides down and give a close below the 11615 level, it might lead to a correction up to 11250 level.
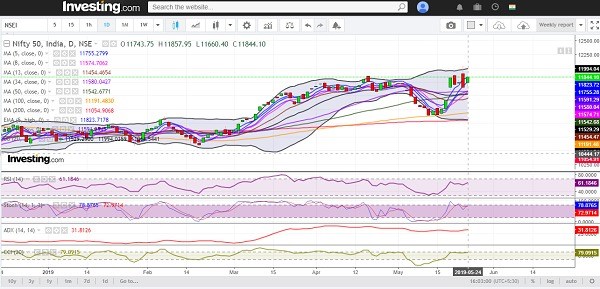
Daily Technical: On the daily chart, the index has formed inside bar formation. So breaking out either direction might create high momentum move. This inside formation can also be called a Bullish Harami pattern. Generally, this pattern comes after a downtrend, but in this case, it is after an upward trending market. So full effectiveness might not be there.
To continue the uptrend, the market has to close above the recently made lifetime high which is at approx. 12040 level. If it happens, the price may touch the 13000 mark.
On the downside breaching below the 11614 level would help bears to retest the 11250 mark.
Technical indicators are showing positive sentiment. RSI is above 60, Stochastic is at approx. 78, ADX is above 30 and the CCI indicator is just below the 80 level.
So overall the sentiment is positive. But as we mentioned earlier only breaking out either direction will create momentum, unless there would be a totally range bound movement.
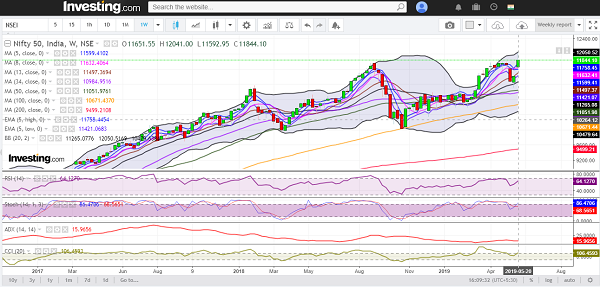
Weekly Technical: In the weekly chart, the index has made an exhaustion candle and this candle suggests there could be a possible halt or trend reversal. However, this does not always stand true. If the Bulls manage to close above the high, the sentiment would be totally changed.
Technical indicators are bullish but there is a lack of momentum and strength compared to the previous Bullish swing (not talking about divergence). RSI is above 60, Stochastic is above 80, ADX is at 15 level and the CCI is above +100.
Overall the sentiment is on the bulls’ side but breaking the high might be difficult. But if there is any breakout, 13000 level might be the next target.
On the other hand, breaching below 11590 might help the bears to push the price further down. The immediate support would be at 11000 level.
You can use StockEdge app to get cutting edge over others in both short term trading and investing. Here you not only get data at one particular place but can also create your own combination scans based on your own technical and fundamental parameter. See the video below to know about various features in StockEdge app.


