Elearnmarkets - Financial Market Learning
  • Courses
  • Webinars
  • Stories
  • Language
    • English
    • Hindi
    • Bengali
No Result
View All Result
Get Free Course
  • Basic Finance
  • Derivatives
    • Futures
    • Options
  • Financial Planning
  • Fundamental Analysis
  • Technical Analysis
  • Mutual Funds
  • Marketshala
  • Miscellaneous
Elearnmarkets - Learn Stock Market, trading, investing for Free
  • Courses
  • Webinars
  • Stories
  • Language
    • English
    • Hindi
    • Bengali
No Result
View All Result
Get Free Course
Elearnmarkets - Learn Stock Market, trading, investing for Free
No Result
View All Result
Home Derivatives
How to use Open Interest to increase profitability

How to use Open Interest Strategy to increase profitability?

Elearnmarkets by Elearnmarkets
May 28, 2024
in Derivatives, Open Interest
Reading Time: 7 mins read
9
53.3k
VIEWS
Share on FacebookShare on XShare on WhatsApp

Most of the traders who trade in the futures market end up in losing money in the futures and options market. The most common mistake they make is that they do not analyze the open interest. Open Interest is one of the important parameters while trading in the futures market. If we start working on open interest strategy with respect to volume and price then the traders will have a high probability of success in their trades and also increase their profitability in the futures and options market

Table of Contents
Understanding Open Interest with respect to Volume
How to analyze open interest data?
Option chain analysis using StockEdge

Understanding Open Interest with Respect to Volume

Open Interest is a statistically unique parameter while trading in futures and options market. Open Interest is the total number of contracts which is presently in existence and is not offset by the closing of trades. Open Interest is different than volume. Volume is the number of contracts traded per day.

If you are buying a future/option then you are opening a position and the person who sold you is also opening a position. The volume is increased by one and open interest would also increase by one. If you sold your future/option to someone else who did not have a position in the market then the volume will increase but the open interest strategy will not change as you have transferred it to someone else that did not have any position in the market earlier.

Also Read: How Open Interest Analysis helps to identify market trends?

Learn about Intraday Options Trading Using Open Interest and Market Profile from a 3-hours expert’s webinar.

Open Interest would have decreased if you had sold the position to someone who already had a position in the futures/options market. Since you are closing positions, open interest goes down whereas the volume increases by one.

How to analyze open interest data?

Open Interest is important for both stock futures traders as well as option traders. Open Interest shows up where the traders are putting their money in. Therefore analyzing and creating open interest strategy is very important. Let’s analyse the open interest data with the help of a stock in the futures market.

Due to the inherent time decay of premium of options, there are generally large numbers of option sellers in the market. For option sellers, the profit is max the premium value of the option sold, while loss possibility is unlimited. Hence these option sellers are generally very nimble-footed and agile to square off their positions in case of any adverse movement.

Now if we observe in the market, we will find that the bullish players sell put options as they get premium if the prices don’t go below the strike price. Similarly, the bearish players sell call options as they look out for gain if the prices don’t go above the strike price.

If there is high build up in the open interest in any particular strike price of calls and puts of a stock, that means market participants see those levels as potential support or resistance zones, depending on the option being call or put.
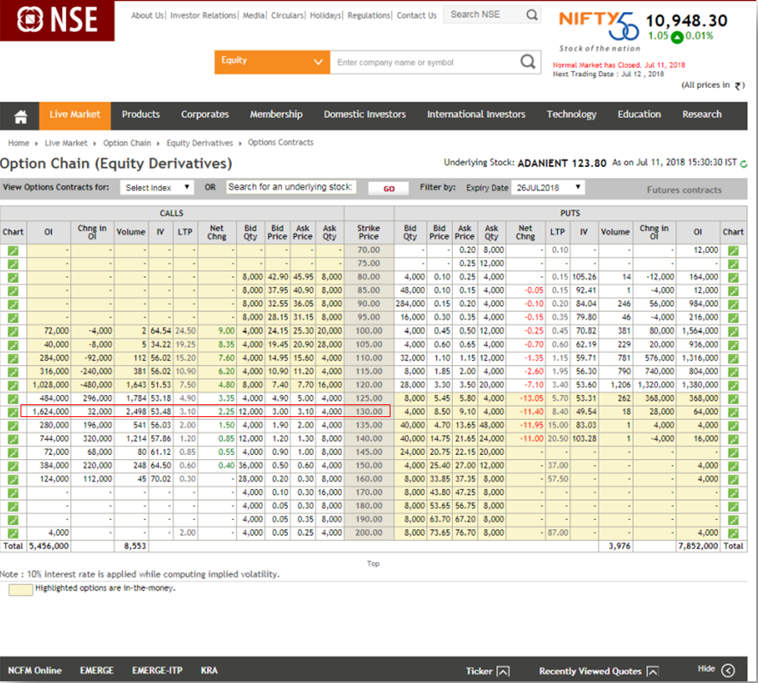
option chain equity derivatives nseindia

Source: NSE Website

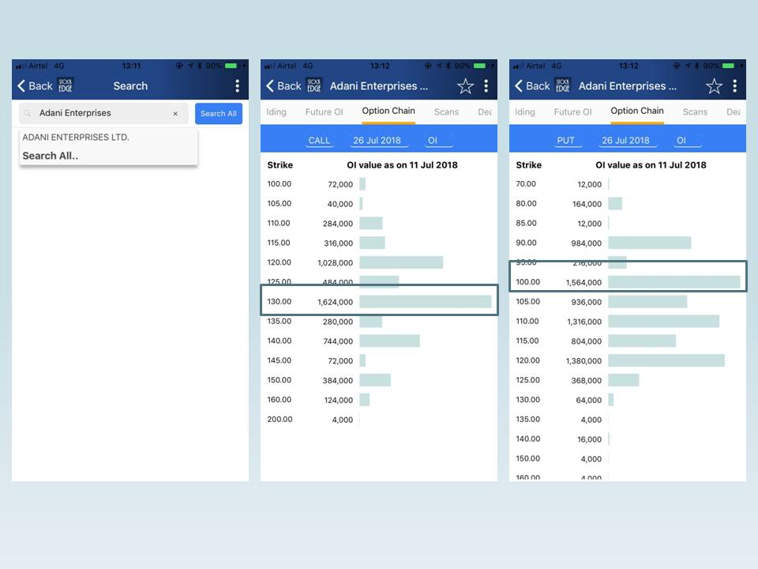
Suppose we take up a stock, say Adani Enterprises. We need to examine at which price the maximum open interest is build up and whether in the call or in the put. We can get the option chain data of any particular stock from the NSE website. In the example, the stock price was 123.80. The stock was already in an uptrend as we can see from the below chart below. From this data table we can see that the maximum open interest is build in the call at Rs. 130. Therefore there are possibilities that if Adani goes to 130, call sellers might want to defend their position by creating more resistance around 130 levels. On the other hand, if price breaches the 130 level, the short covering of call writers can push the stock even higher. Let us see, what happened next.

adani enterprise ltd chart

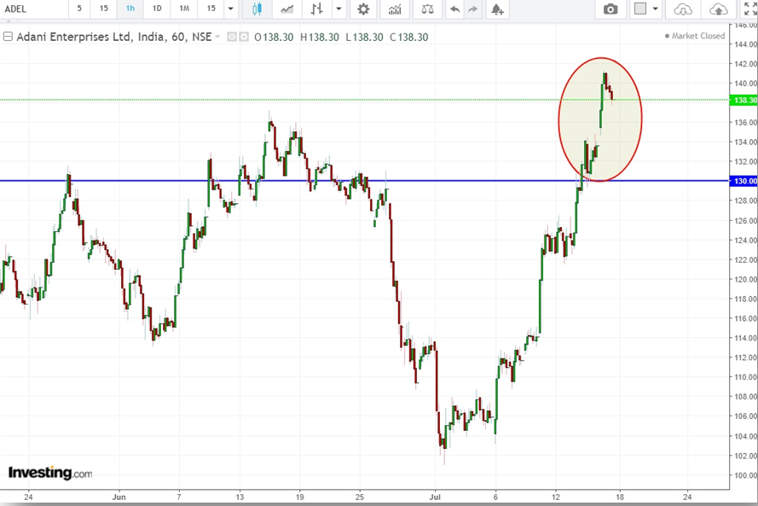
As we can see after breaching the 130 mark, the stock temporarily took support around 130 and eventually moved fast in an upward direction. Two days later we can see, call open interest at 130 has gone down due to short covering, while there has been huge put addition in 130 strike making it a near-term support. Also, we can notice that now Adani has huge call build-up at 140 and a 150 strike price. Hence if Adani goes higher, price action and open interest behavior in options around 140/ 150 will be crucial.
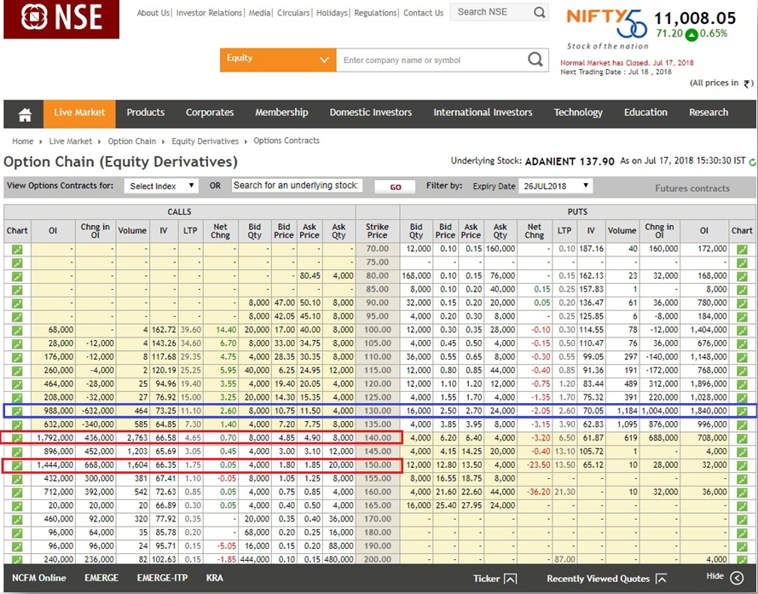
option chain analysis

Source: NSE Website

Now let us another example:-

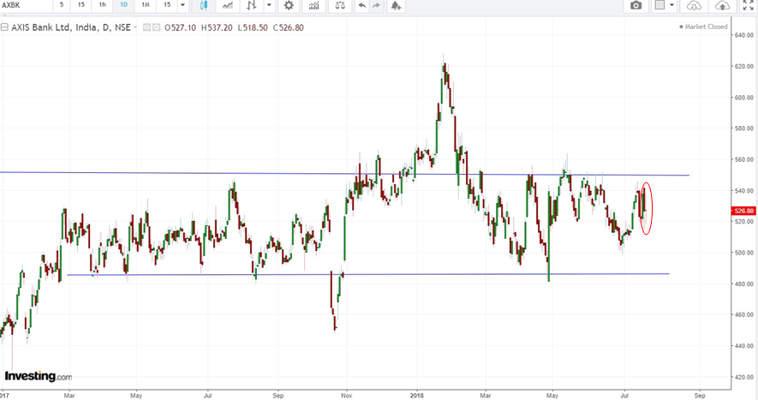
Let’s take up another stock, say Axis bank. In the example the stock price was Rs. 523.3. This stock is broadly a range bound stock as we can see from the chart below. From this data table we can see that the maximum open interest in Put side is build in the put at Rs. 500. Therefore there are possibilities that if Axis Bank goes down to 500, put writers might want to defend their position by creating more support around 500 levels. Similarly, we can see very large amount of open interest build-up in 530 and 540 calls. Hence there is a possibility that the stock may remain broadly range-bound in the 500-540 range.

axis bank chart

Let us see what happened next

We can see 4 days later that the stock still remained in the range, as could be predicted from OI data analysis. If we look at the open interest data after 4 days we can see that OI remained more or less same in 500 puts and 530 and 540 calls.
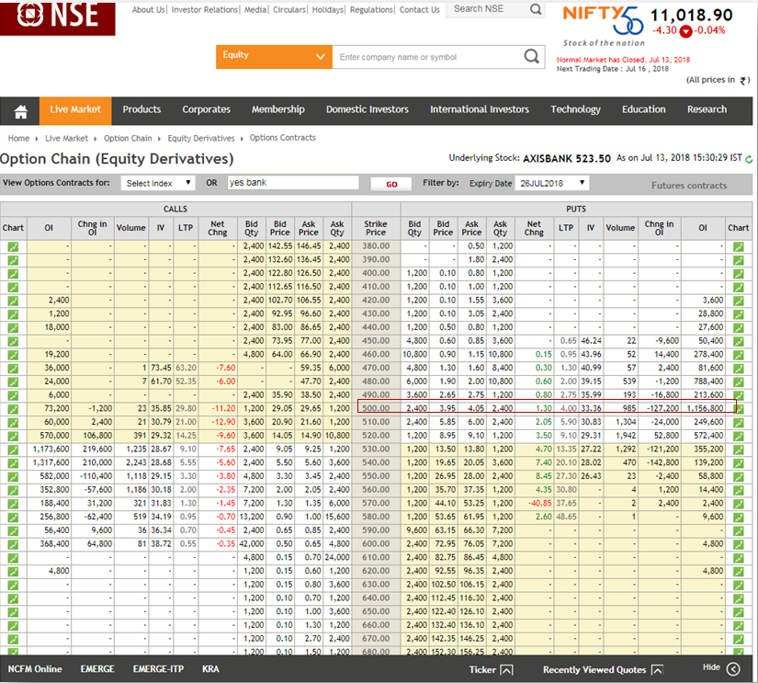
equity derivatives nse India

Source: NSE Website

Option chain analysis using StockEdge

We can get this data from StockEdge also. Suppose we want to find option chain data of Adani Enterprises in the StockEdge. We can go to the stock sections and in the search panel write the name of the stock, say Adani Enterprises. Then in the option chain tab we will get the call data of the present month expiry. Here in one glance only we can see that maximum open interest strategy is build up at Rs. 130. We can also the put data of open interest of the present month. Here the maximum open interest is build up at Rs 100 but is less than open interest build up Rs. 130. So we can expect an uptrend by analyzing this. StockEdge can provide you all the relevant details for better analysis

stockedge-adani

Bottom Line

Traders usually give more importance to technical and fundamental analysis and they ignore the open interest analysis which can increase their profitability while trading in the futures market. Volume and open interest are both important aspects that they should equally consider, especially when they look at very short-term supports and resistances. This should add an extra edge to their analysis and increase their profitability.

You can watch the full Face2Face Video here-

https://www.youtube.com/embed/fBVqRTJVGLY
Tags: derivativederivative marketderivativesenglishoption hedgingoptionsoptions trading strategies
Share15TweetSend
Get Kotak Offer Get Kotak Offer Get Kotak Offer
Previous Post

Credit Default Swaps in the Indian Financial Markets

Next Post

What are Shariah compliant mutual funds?

Elearnmarkets

Elearnmarkets

Elearnmarkets (ELM) is a complete financial market portal where the market experts have taken the onus to spread financial education. ELM constantly experiments with new education methodologies and technologies to make financial education effective, affordable and accessible to all. You can connect with us on Twitter @elearnmarkets.

Related Posts

Forex vs Stocks
Miscellaneous

Forex vs Stocks: Which Market Should You Trade First

May 13, 2025
94
Collar Option Strategy
Options

How to Use Collar Option Strategy?

May 2, 2025
125
Futures vs Options
Derivatives

Futures vs Options: What’s the Difference?

December 26, 2024
827
Scalping Trading Strategies
Options

Top 5 Scalping Trading Strategies For Higher Return

May 5, 2025
4.3k

Comments 9

  1. G. Allen says:
    6 years ago

    Could you kindly let me know if StockEdge is available ONLY as an App… or also available
    on the PC Desktop. If it is available on the Desktop.. how is to be accessed? Thanks

    Reply
    • Sakshi Agarwal says:
      6 years ago

      Hi,

      It is only available in the app version.

      Reply
  2. Prakash says:
    5 years ago

    Can i compare 3 different CE and PE options on single screen? Lets say the price is 100 and options plus or minus 5 and CE and pe (total 6 including the SP). So CE and PE of 95,10010 105.

    Reply
    • Sakshi Agarwal says:
      5 years ago

      Hi Prakash,

      You can compare different CE and PE of different tables from the NSE option chain table of that particular stock.

      Thanks for Reading!

      Keep Reading!

      Reply
  3. frolep rotrem says:
    5 years ago

    Hello! Would you mind if I share your blog with my twitter group? There’s a lot of people that I think would really appreciate your content. Please let me know. Thank you

    Reply
  4. Hardik Gupta says:
    5 years ago

    Sakshi, you are a genius!

    From ages, I was struggling to understand OI, but after reading your blog, I felt that it was a piece of cake.

    Keep up girl!!

    Reply
    • Sakshi Agarwal says:
      5 years ago

      Hi,

      Thank you for reading our blog!!

      Keep Reading!

      Reply
  5. Sandeep says:
    4 years ago

    In simple words, you have explained OI , really thanks for information and spending time to share such things for us.

    Reply
    • Sakshi Agarwal says:
      4 years ago

      Hi,

      Thank you for Reading!

      Keep Reading!

      Reply

Leave a Reply Cancel reply

Your email address will not be published. Required fields are marked *

Disclaimer

Elearnmarkets (Kredent InfoEdge Pvt. Ltd.) is a SEBI-registered Research Analyst (RA) entity (SEBI Registration No.: INH300007493). The information provided in this article is for educational and informational purposes only and should not be considered as an offer to buy or sell any securities or investment products.

The stocks, securities, and investment instruments mentioned herein are not recommendations under SEBI (Research Analysts) Regulations, 2014. Readers are advised to conduct their own due diligence and seek independent financial advice before making any investment decisions.

Investments in securities markets are subject to market risks. Please read all related documents carefully before investing. Investing in Equity Shares,
Derivatives, Mutual Funds, or other instruments carry inherent risks, including potential loss of capital. Elearnmarkets (Kredent InfoEdge Pvt. Ltd.) does not provide any guarantee or assurance of returns on any investments. Past performance is not indicative of future performance.

Elearnmarkets Logo

Follow Us

Facebook-f X-twitter Instagram Linkedin-in Youtube Telegram

Register on Elearnmarkets

Continue your financial learning by creating your own account on Elearnmarkets.com

Register Free Account

Download App

Playstore logo
Download on app store

Categories

  • Basic Finance
  • Derivatives
  • Financial Planning
  • Fundamental Analysis
  • Technical Analysis
  • Mutual Funds
  • Miscellaneous

Popular On Elearnmarkets

  • Market Superheroes:
  • Vivek Bajaj
  • Chetan Panchamia
  • Ashish Kyal
  • Premal Parekh
  • Abhijit Paul
  • Jegan
  • Sivakumar Jayachadran
  • Jyoti Budhia
  • Vivek Gadodia
  • Vishal Mehta
  • Piyush Chaudhry
  • Santosh Pasi
  • Gomathi Shankar
  • Market Superheroes:
  • Vivek Bajaj
  • Chetan Panchamia
  • Ashish Kyal
  • Premal Parekh
  • Abhijit Paul
  • Jegan
  • Sivakumar Jayachadran
  • Jyoti Budhia
  • Vivek Gadodia
  • Vishal Mehta
  • Piyush Chaudhry
  • Santosh Pasi
  • Gomathi Shankar
  • Courses:​
  • Options Trading
  • Dow Theory
  • Momentum Trading
  • Stock Investing
  • Harmonic Chart Patterns
  • Algo Trading
  • Elliot Wave Theory
  • Advanced Excel
  • Cryptocurrency
  • NSE Certification Course
  • Courses:​
  • Options Trading
  • Dow Theory
  • Momentum Trading
  • Stock Investing
  • Harmonic Chart Patterns
  • Algo Trading
  • Elliot Wave Theory
  • Advanced Excel
  • Cryptocurrency
  • NSE Certification Course
  • Webinars:
  • Bank Nifty Scalping
  • Intraday Trading Strategies
  • Options Trading Strategies
  • Options selling
  • Price Action
  • Relative Strength
  • Tax Planning
  • Options Buying
  • Growth Stocks
  • Portfolio Management
  • Risk Management
  • Renko Charts
  • Crude Oil
  • Traders Psychology
  • Moving Average
  • Multibagger Stocks
  • Free Learning Modules:
  • Intraday Trading
  • Options Scalping
  • Swing Trading
  • Financial Modelling
  • RSI Indicator
  • Bollinger Bands
  • Pricing of Futures
  • Personal Finance
  • Initial Public Offerings (IPO)
  • Value Investing
  • Technical Indicators
  • Candlesticks
  • Chart Patterns
  • Option Greeks
  • ELSS Funds
  • Banking and Insurance
  • Real Estate
  • Gold
  • Book Summaries:
  • Rich Dad Poor Dad
  • Psychology of Money
  • The Intelligent Investor
  • The Richest Man in Babylon
  • Think and Trade Like a Champion
  • Value Investing and Behavioural Finance
  • Trading in the Zone
  • Learn to Earn
  • Book Summaries:
  • Rich Dad Poor Dad
  • Psychology of Money
  • The Intelligent Investor
  • The Richest Man in Babylon
  • Think and Trade Like a Champion
  • Value Investing and Behavioural Finance
  • Trading in the Zone
  • Learn to Earn
  • Tools:
  • CAGR Calculator
  • SIP Calculator
  • eLearnOptions
  • Future Value Calculator
  • Present Value Calculator
  • Atal Pension Yojana
  • Cost of Delay Calculator
  • Become a Crorepati
  • Tools:
  • CAGR Calculator
  • SIP Calculator
  • eLearnOptions
  • Future Value Calculator
  • Present Value Calculator
  • Atal Pension Yojana
  • Cost of Delay Calculator
  • Become a Crorepati

© 2025 Elearnmarkets. All Rights Reserved

  • Visit Elearnmarkets
  • Courses
  • Webinars
  • Financial Guides
  • Get Free Counselling
  • Visit Elearnmarkets
  • Courses
  • Webinars
  • Financial Guides
  • Get Free Counselling

Download Our App

No Result
View All Result
  • Article Categories
    • Basic Finance
    • Derivatives
    • Financial Planning
    • Fundamental Analysis
    • Technical Analysis
    • ETFs & Mutual Funds
    • Marketshala
    • Miscellaneous
  • Language
    • Hindi
    • Bengali
    • English
  • Courses
  • Webinars
  • Stories
Get Free Course

© 2024 Elearnmarkets All Rights Reserved

Guide to Options Strategies
Discover Options Strategies For Making Money In All Market Conditions
Download Guide For FREE
Trading Day 2025