Elearnmarkets - Financial Market Learning
  • Courses
  • Webinars
  • Stories
  • Language
    • English
    • Hindi
    • Bengali
No Result
View All Result
Get Free Course
  • Basic Finance
  • Derivatives
    • Futures
    • Options
  • Financial Planning
  • Fundamental Analysis
  • Technical Analysis
  • Mutual Funds
  • Marketshala
  • Miscellaneous
Elearnmarkets - Learn Stock Market, trading, investing for Free
  • Courses
  • Webinars
  • Stories
  • Language
    • English
    • Hindi
    • Bengali
No Result
View All Result
Get Free Course
Elearnmarkets - Learn Stock Market, trading, investing for Free
No Result
View All Result
Home Fundamental Analysis
778_ELM_Blog Image_03 (2)

How to Use Enterprise Value for Searching Stocks for Investment

Elearnmarkets by Elearnmarkets
August 21, 2024
in Fundamental Analysis
Reading Time: 6 mins read
0
2k
VIEWS
Share on FacebookShare on XShare on WhatsApp

The Enterprise value is a fundamental indicator of how the market attributes value to a firm as a whole. This term is used by the analysts in order to discuss the aggregate value of a company as an enterprise rather than just focusing on its present market capitalization. Learning about Fundamental Analysis will help you to understand this term.

What is Enterprise Value?

Enterprise Value (EV) represents the entire economic value of the company. More specifically, it is a measure of the theoretical takeover price that an investor would have to pay to acquire a particular company/business. It is a part of the basic foundation of stock analysis for the value investor.

The Purpose of Calculating Enterprise Value (EV) is:

  • To know what it would cost to purchase the entire company/business.
  • To provide a capital neutral valuation that helps in comparing with other companies.

Now the question is how can you/ to calculate Enterprise value.

 Enterprise value is calculated as follows:

The simple formula for enterprise value is

EV = Market value of equity (Market Capitalization) + Market value of debt (Total Debt) – Cash and cash equivalent.

 The extended formula is

EV = Market capitalization + Debt + Minority share + Preferred equity – Cash and Cash equivalent

EV

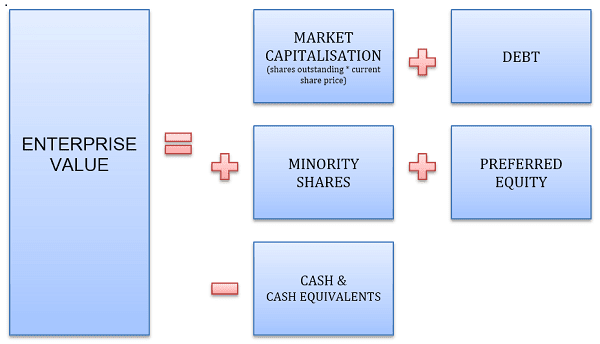
Source: Investing PR

  •  Market Capitalization is arrived by simply multiplying the current market price with the number of outstanding equity shares.
  • Total debt is generally taken as outstanding long term and short term debt reported in the balance sheet of the company.
  • Preferred shares if they are redeemable then they are treated as debt.
  • Minority share is defined as the portion of subsidiaries that is held by the minority shareholder.
  • Cash and cash equivalents reported in the balance sheet of the company.

The Role of Debt and Cash:

Company’s Enterprise Value is strongly impacted by Debt and cash.

Think of two companies that have an equal market capitalization. One has no debt on its balance sheet while the other one has some debt on its balance sheet. The debt-laden company will be making an interest payment on the debt over the years.(preferred stocks and convertible that pay interest should also be considered debt for the purpose of calculating value) So, even though the two companies have equal market caps, the company with debt is worth more.

Enterprise Value

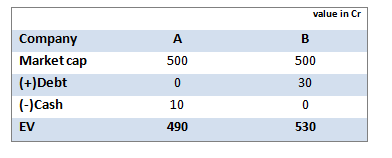
For example:  Company A and Company B both have equal market capitalization of 500 cr. Company A has 0 Debt and Rs 10 cr in cash while Company B has Rs 30 cr of Debt and no cash.

Company A would be cheaper to acquire than the company B.

Debt increases the cost of purchasing a company, therefore an addition in the EV calculation formula. On the other hand, cash would be an asset, so it is subtracted in the EV calculation.

Importance of Enterprise Value:

  • It tells us the theoretical take over price (worth) of the company.
  • It represents the economic value of the company.
  • It is help in valuing capital intensive businesses and help in comparing company with different capital structure.
  • For the stock market investors it is used to neutralize the risk and accordingly compare the returns expected.

Important Multiples of Enterprise Value:

  • EV/EBIT: Enterprise Value to EBIT Ratio:

The Enterprise Value can be compared with earnings available to the entire capital (both equity and debt). EV/EBIT is a way of deciding whether a share is cheap or expensive relative to its peers.

It is similar to the commonly use price/earnings ratio (P/E), rather than using just the firm’s share price- which ignores debt – it uses enterprise value (combined value of debt(less cash) and equity fund of the business).

  • EV/EBITDA:  Enterprise Value to EBITDA ratio:

Sometimes market participant use EBITDA instead of EBIT because depreciation and amortization is a non cash expense. EV to EBITDA ratio measures how cheap or expensive the business is. The higher the ratio, more expensive the business and lower the ratio, cheaper the business.

  • EV/SALES: Enterprise Value to sales ratio

Enterprise value to sales is a valuation measure that compares enterprise value (EV) of a company to the company’s Sales. EV/SALES give investors a quantifiable metric of how much it costs to purchase the company’s sales.

Enterprise value to sales is an expansion of the price to sales (P/S) valuation. EV/Sales perceived to be more accurate than P/S, because market capitalization doesn’t take a company’s debt into account when valuing the company.

Generally, a lower EV/Sales means that a company is believed to be more attractive or undervalued.

Bottomline

Any investment in a particular company would need detailed information on the fundamental of the company and its comparison with their peers. Enterprise Value plays a very important role in doing the fundamental analysis of the company and help in comparing with the peers. By using enterprise value instead of market capitalization, investors get a more accurate picture of whether or not a company is truly undervalued or not.

Tags: englishenterprise valuemarket capitalization
ShareTweetSend
Get Kotak Offer Get Kotak Offer Get Kotak Offer
Previous Post

Stock Split Vs. Bonus: The Difference You Should Know

Next Post

Assets and Liabilities – Types, Differences and Valuation

Elearnmarkets

Elearnmarkets

Elearnmarkets (ELM) is a complete financial market portal where the market experts have taken the onus to spread financial education. ELM constantly experiments with new education methodologies and technologies to make financial education effective, affordable and accessible to all. You can connect with us on Twitter @elearnmarkets.

Related Posts

Top 5 Valuation Ratios in the Stock Market 1
Fundamental Analysis

Top 5 Valuation Ratios in the Stock Market

May 5, 2025
872
price to sales ratio
Fundamental Analysis

Price to Sales Ratio: A Key Metric for Understanding Company Value

May 5, 2025
462
Gearing Ratio
Fundamental Analysis

What Is the Gearing Ratio? Formula & Calculation

December 3, 2024
1.2k
Top 5 Fundamental Analysis Tools 2
Fundamental Analysis

Top 5 Fundamental Analysis Tools

January 31, 2025
4.2k

Leave a Reply Cancel reply

Your email address will not be published. Required fields are marked *

Disclaimer

Elearnmarkets (Kredent InfoEdge Pvt. Ltd.) is a SEBI-registered Research Analyst (RA) entity (SEBI Registration No.: INH300007493). The information provided in this article is for educational and informational purposes only and should not be considered as an offer to buy or sell any securities or investment products.

The stocks, securities, and investment instruments mentioned herein are not recommendations under SEBI (Research Analysts) Regulations, 2014. Readers are advised to conduct their own due diligence and seek independent financial advice before making any investment decisions.

Investments in securities markets are subject to market risks. Please read all related documents carefully before investing. Investing in Equity Shares,
Derivatives, Mutual Funds, or other instruments carry inherent risks, including potential loss of capital. Elearnmarkets (Kredent InfoEdge Pvt. Ltd.) does not provide any guarantee or assurance of returns on any investments. Past performance is not indicative of future performance.

Elearnmarkets Logo

Follow Us

Facebook-f X-twitter Instagram Linkedin-in Youtube Telegram

Register on Elearnmarkets

Continue your financial learning by creating your own account on Elearnmarkets.com

Register Free Account

Download App

Playstore logo
Download on app store

Categories

  • Basic Finance
  • Derivatives
  • Financial Planning
  • Fundamental Analysis
  • Technical Analysis
  • Mutual Funds
  • Miscellaneous

Popular On Elearnmarkets

  • Market Superheroes:
  • Vivek Bajaj
  • Chetan Panchamia
  • Ashish Kyal
  • Premal Parekh
  • Abhijit Paul
  • Jegan
  • Sivakumar Jayachadran
  • Jyoti Budhia
  • Vivek Gadodia
  • Vishal Mehta
  • Piyush Chaudhry
  • Santosh Pasi
  • Gomathi Shankar
  • Market Superheroes:
  • Vivek Bajaj
  • Chetan Panchamia
  • Ashish Kyal
  • Premal Parekh
  • Abhijit Paul
  • Jegan
  • Sivakumar Jayachadran
  • Jyoti Budhia
  • Vivek Gadodia
  • Vishal Mehta
  • Piyush Chaudhry
  • Santosh Pasi
  • Gomathi Shankar
  • Courses:​
  • Options Trading
  • Dow Theory
  • Momentum Trading
  • Stock Investing
  • Harmonic Chart Patterns
  • Algo Trading
  • Elliot Wave Theory
  • Advanced Excel
  • Cryptocurrency
  • NSE Certification Course
  • Courses:​
  • Options Trading
  • Dow Theory
  • Momentum Trading
  • Stock Investing
  • Harmonic Chart Patterns
  • Algo Trading
  • Elliot Wave Theory
  • Advanced Excel
  • Cryptocurrency
  • NSE Certification Course
  • Webinars:
  • Bank Nifty Scalping
  • Intraday Trading Strategies
  • Options Trading Strategies
  • Options selling
  • Price Action
  • Relative Strength
  • Tax Planning
  • Options Buying
  • Growth Stocks
  • Portfolio Management
  • Risk Management
  • Renko Charts
  • Crude Oil
  • Traders Psychology
  • Moving Average
  • Multibagger Stocks
  • Free Learning Modules:
  • Intraday Trading
  • Options Scalping
  • Swing Trading
  • Financial Modelling
  • RSI Indicator
  • Bollinger Bands
  • Pricing of Futures
  • Personal Finance
  • Initial Public Offerings (IPO)
  • Value Investing
  • Technical Indicators
  • Candlesticks
  • Chart Patterns
  • Option Greeks
  • ELSS Funds
  • Banking and Insurance
  • Real Estate
  • Gold
  • Book Summaries:
  • Rich Dad Poor Dad
  • Psychology of Money
  • The Intelligent Investor
  • The Richest Man in Babylon
  • Think and Trade Like a Champion
  • Value Investing and Behavioural Finance
  • Trading in the Zone
  • Learn to Earn
  • Book Summaries:
  • Rich Dad Poor Dad
  • Psychology of Money
  • The Intelligent Investor
  • The Richest Man in Babylon
  • Think and Trade Like a Champion
  • Value Investing and Behavioural Finance
  • Trading in the Zone
  • Learn to Earn
  • Tools:
  • CAGR Calculator
  • SIP Calculator
  • eLearnOptions
  • Future Value Calculator
  • Present Value Calculator
  • Atal Pension Yojana
  • Cost of Delay Calculator
  • Become a Crorepati
  • Tools:
  • CAGR Calculator
  • SIP Calculator
  • eLearnOptions
  • Future Value Calculator
  • Present Value Calculator
  • Atal Pension Yojana
  • Cost of Delay Calculator
  • Become a Crorepati

© 2025 Elearnmarkets. All Rights Reserved

  • Visit Elearnmarkets
  • Courses
  • Webinars
  • Financial Guides
  • Get Free Counselling
  • Visit Elearnmarkets
  • Courses
  • Webinars
  • Financial Guides
  • Get Free Counselling

Download Our App

No Result
View All Result
  • Article Categories
    • Basic Finance
    • Derivatives
    • Financial Planning
    • Fundamental Analysis
    • Technical Analysis
    • ETFs & Mutual Funds
    • Marketshala
    • Miscellaneous
  • Language
    • Hindi
    • Bengali
    • English
  • Courses
  • Webinars
  • Stories
Get Free Course

© 2024 Elearnmarkets All Rights Reserved

How to Spot False Dips and Trade with Confidence