In an interesting session as a part of the highly popular MarketShala series, conducted by Elearnmarkets; Mr. Vivek Bajaj, Co-founder of Elearnmarkets, and Mr. Chetan Panchamia, a prolific intraday trader and trainer with many years of experience came together to decode how to exit a stock in stock trading.
Here is a short discussion about this session. If you want to get a practical understanding of how to exit a stock, watch the full video at the end of this blog.
While trading in the share market, entry is easy but the decision of when to exit a stock is difficult.
One of the biggest problems faced by individual traders is that they enter the stock based on some recommendations or tips but they don’t how to exit a stock.
In this blog, we will discuss how regular traders can exit the stock and also how long-term investors can exit a stock.
When we initiate a trade, then we are supposed to be trading with the objective of how much profit should we book and exit a stock.
We usually trade with the objective of 2:1 reward-risk ratio, i.e., with the objective of getting 2 times the profit and 1 time loss in case the trade goes against our expectations. As a trader, one needs to decide how to exit the profit or how to exit the stop-loss.
Let us discuss in detail how to enter and exit a stock in stock trading.
How to enter and exit a stock?
The retail investors get various tips and recommendations regarding which stocks to trade in but they do not get a formula of how to exit the stock after it.
Once we decide which stocks to enter, firstly we should see whether the stock is bullish or bearish.
We can identify whether the stock is bullish with the help of the parameter : 52-week high. If any stock is in the 52-week high zone, that means the bulls are trading in that stock who might make the stock’s price to rise.
If any stock is trading near 15% of the 52-week high, then that zone is termed as the 52-week high zone.
For example, If the 52-week high of any stock is 100 and if it is trading in the zone of 85-100, then this stock can be identified as a bullish stock.
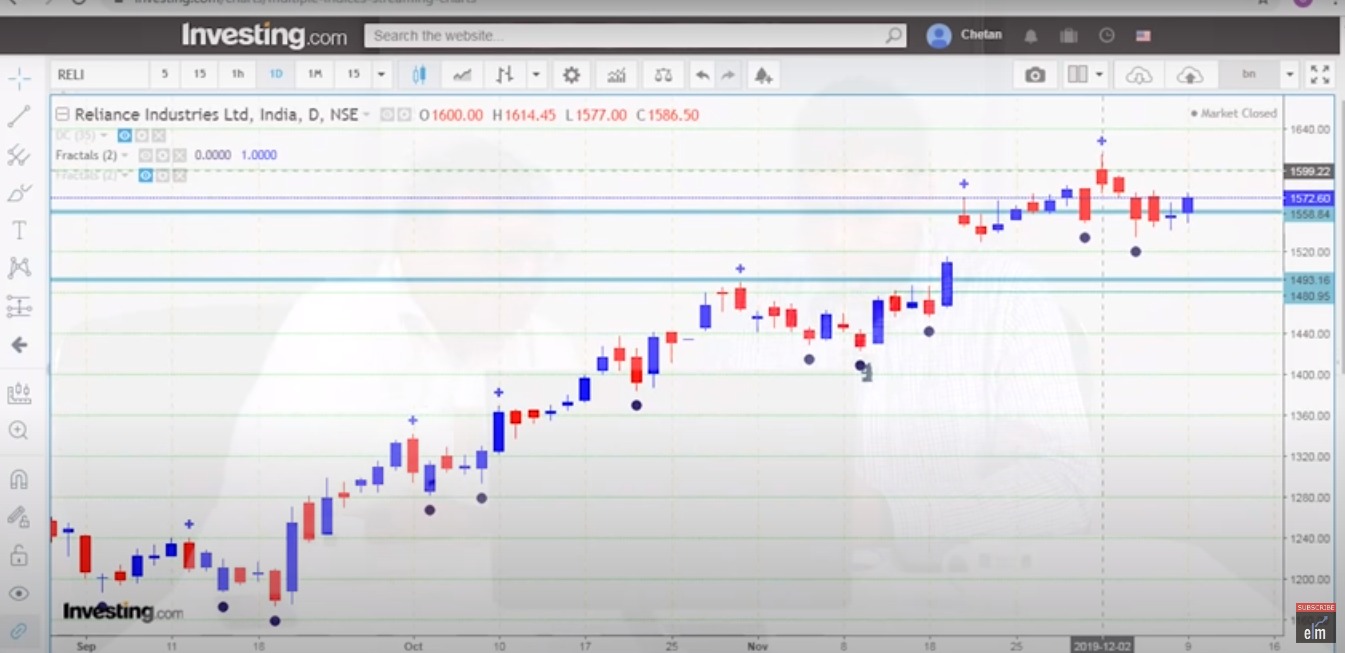
For example, The 52-week high of Reliance Industries Ltd. is 1615, then the 52-week high zone will be (1615*.85) = 1372 and the stop-loss zone is below 1372.
So the traders can enter this stock at the recommended price or the price near the support. But traders should keep in mind that if the price goes below the stop-loss, then they should exit the stock.
Now the question arises, How to identify which stocks are in the 52 week high or low zone?
How to identify which stocks are in 52 weeks high or low zone?
In StockEdge, there is a tool that provides us with various scans, with the help of which we can identify which stocks are in the 52-week high or low zone.

In StockEdge under the scans tab we will get price scans which have scans like 52 Week Breakout Scans which will help us to identify 52 high or low stocks.

When we click on one of the scans shown above, for example when we click on the scan “Close Crossing 52 week low” then we will get a list of stocks which is crossing 52 week low zone as shown below:

When the stock is in the 52 week low zone, it means that there are sellers and no buyer in that stock.
Traders should note they should not buy the stocks when they are in 52 week low zone as sellers are still there in that stock and they might push the down the price more.
Traders can enter the stock once the stock rising from the 52 week low zone.
Traders can also check the fundamental parameters of the companies in which they have in their watchlist in StockEdge.

So the traders can buy the stock which is in the 52 weeks high zone and sell the stocks which are in the 52 weeks low zone.
Check out more articles on StocKEdge blog.
You can watch the entire video on How to exit the stock below:
Happy Investing!


