Elearnmarkets - Financial Market Learning
  • Categories
    • Basic Finance
    • Derivatives
      • Futures
      • Options
    • Financial Planning
    • Fundamental Analysis
    • Technical Analysis
    • Marketshala
    • Miscellaneous
  • Language
    • English
    • Hindi
    • Bengali
No Result
View All Result
  • Courses
  • Webinars
  • Stories
Elearnmarkets - Learn Stock Market, trading, investing for Free
No Result
View All Result
Home Basic Finance
FII and DII Analysis relative to NIFTY price movement 1

FII and DII Analysis relative to NIFTY price movement

Elearnmarkets by Elearnmarkets
July 19, 2023
in Basic Finance, Capital Markets
Reading Time: 5 mins read
0
15.5k
VIEWS
Share on FacebookShare on XShare on WhatsApp

fii and dii analysis

FII and DII Analysis: Relation with NIFTY price movements

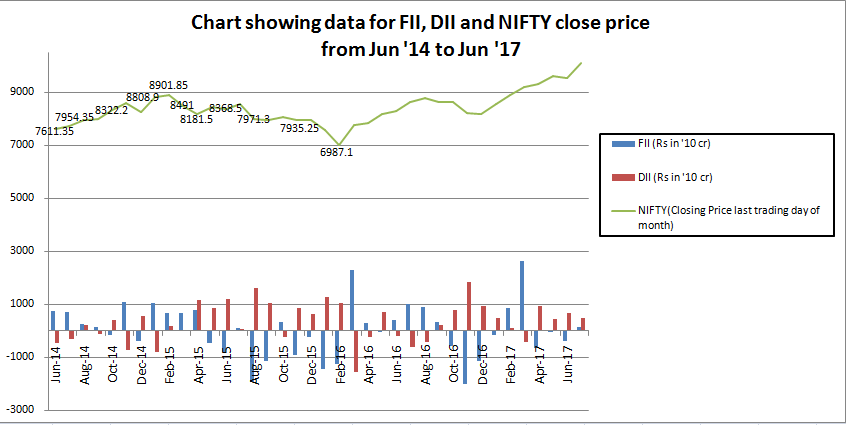
In today’s blog let us dive deep into the analysis of FII DII Data and its relation with NIFTY price movement. The analysis of stock market indices to predict the state of the markets is an important part of technical analysis. Mr. Narendra Modi coming to power as the Prime Minister of India in June 2014 led to the hopes of a long-term bull market.

As it can be seen from the chart, soon after the new Prime Minister was elected, NIFTY witnessed a steady upmove for 8 consecutive months (July ’14- Feb ’15).

The sharp correction in February 2016 (NIFTY close price: 6987), combined with the constant downtrend in the past 1 year (March ‘15- Feb ‘16) negated market hopes of the start of a long-term bull market completely.

However, when March 2016 saw an unanticipated rise in NIFTY prices, the hopes were instilled again.

FII-DII graph vs NIFTY prices from Jun 2014-July 2017

In the above chart, the first thing that the eyes automatically track is the clear change in trend during the period January 2016 to March 2016.

We can see a sharp dip in the NIFTY prices in February 2016, in contrast to a slow gradual downtrend seen in the previous 1 year.

RelatedPosts

How to Invest in Shares: A Beginner’s Guide 2

How to Invest in Shares: A Beginner’s Guide

September 27, 2023
25.7k
Top 9 Types of Trading Order 3

Top 9 Types of Trading Order

September 22, 2023
36.1k
Online Stock Market Trading: Everything You Need to Know 4

Online Stock Market Trading: Everything You Need to Know

September 20, 2023
867

March 2016 marked an upcoming rally in NIFTY prices which seems to be continuing even today.

Although there have been temporary corrections since March 2016, overall there was a clear uptrend.

As of February 2016, not domestic investors but rather, Foreign Institutional Investors (FIIs) were deemed to be the force behind providing a direction to the Indian markets.

This is because, according to the Indian Express, FIIs held around 40% of the free-float of Indian markets.

And according to this guiding principle, FIIs which sold Rs. 125.13 crore worth equities in February 2016 can be assumed to be the reason behind the fall in the NIFTY prices in that month.

FIIs had moved out, citing trouble from a global growth perspective and on account of incurring losses in commodity and oil prices, combined with the phenomenon of increasing Non-Performing Assets (NPAs) of the Public Sector Banks in India.

Since the market mayhem was mostly driven by global factors, Domestic Institutional Investors continued to show positive figures (buying trend) in February as well.

Throughout the downtrend from March 2015 to February 2016, DIIs have almost always been highly positive (net buyers) and FIIs have almost always been negative (net sellers).

This can lead us to make an assumption that there was fundamentally no or minimal problem in the nation and the market movement, driven by FIIs was a result of a global outlook.

November 2016 witnessed FIIs selling equity stake worth Rs. 199.82 cr, a direct impact of the government announcing demonetization of 500 and 1000-rupee notes, combined with the surprising results of the US Presidential elections.

March 2017 witnessed extremely high FIIs in the Indian market.

With NIFTY ending higher for the 3rd consecutive month in March 2017, FIIs recorded the highest monthly inflow in the history of India, according to the data provided by Central Depository Services (India) Ltd.

The higher high of NIFTY and the huge FIIs reflecting higher investor sentiment seemed to be the result of a change in ruling party in Uttar Pradesh with the election of a new Chief Minister.

DII replacing FII in dominating the trend of NIFTY movement

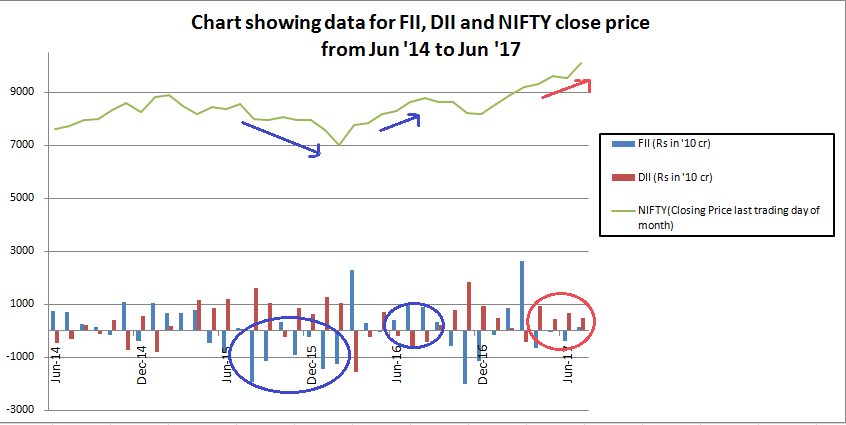
As we can see from the chart above, FIIs no longer dominate the trend of the market, that is, they no longer determine the direction of NIFTY price movement.

Since June 2017, DIIs have come to dominate the NIFTY price movement and this can also be seen in the August 2017 chart (below).

Despite continued selling of FIIs throughout the month, NIFTY remained around its range of 9711-10115.

FII DII vs NIFTY chart for August 2017

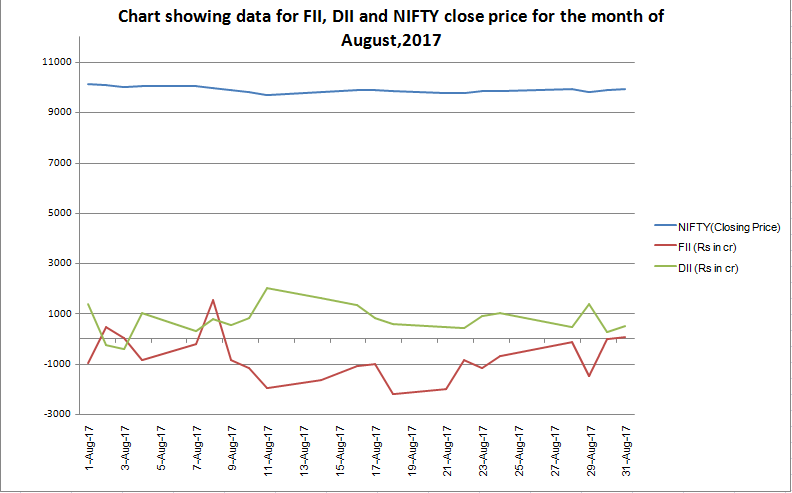
Thus, a detailed analysis of the month of August 2017 shows us a constant selling trend in FIIs with the exception of 8th August 2017. This day witnessed heavy buying in both FII and DII of around Rs.1539 cr and Rs. 798 cr. respectively.  The entire month witnessed positive DII values and hence, we can assume that internally, the Indian economy is quite secure and steadily growing.

You can get a more clear understanding of the analysis of FII DII data relative to the NIFTY Price movement by watching the video below:


Bottomline:

Thus, we can see from the above article that FII and DII analysis acts as an important force to influence the Nifty movement to a large extent.

NOTE: All data has been taken from the StockEdge.

Discover FII DII monthly data from the StockEdge App. Also, find FII F&O data in StockEdge.

All the above FII and DII Analysis are for the cash market.

Also Read: FIIs Importance In Indian Stock Markets

Keep Learning!!

Tags: diienglishfiiforeign institutional investorinvestment basicsnifty
ShareTweetSend
Get Kotak Offer Get Kotak Offer Get Kotak Offer
Previous Post

Bank Nifty Grinds Ahead, Bulls Likely to Face Speed Breakers

Next Post

Nifty Got Resisted At All Time High; Sees Profit Booking

Elearnmarkets

Elearnmarkets

Elearnmarkets (ELM) is a complete financial market portal where the market experts have taken the onus to spread financial education. ELM constantly experiments with new education methodologies and technologies to make financial education effective, affordable and accessible to all. You can connect with us on Twitter @elearnmarkets.

Related Posts

How to Invest in Shares: A Beginner’s Guide 5
Basic Finance

How to Invest in Shares: A Beginner’s Guide

September 27, 2023
25.7k
Top 9 Types of Trading Order 6
Basic Finance

Top 9 Types of Trading Order

September 22, 2023
36.1k
Online Stock Market Trading: Everything You Need to Know 7
Basic Finance

Online Stock Market Trading: Everything You Need to Know

September 20, 2023
867
How this 28-year-old became a Successful Stock Picker! 8
Capital Markets

How this 28-year-old became a Successful Stock Picker!

September 22, 2023
1.1k

Leave a Reply Cancel reply

Your email address will not be published. Required fields are marked *

Elearnmarkets Logo

Follow Us

Facebook-f Twitter Instagram Linkedin-in Youtube Telegram

Register on Elearnmarkets

Continue your financial learning by creating your own account on Elearnmarkets.com

Register Free Account

Download App

Playstore logo
Download on app store

Categories

  • Basic Finance
  • Derivatives
  • Financial Planning
  • Fundamental Analysis
  • Technical Analysis
  • Marketshala
  • Miscellaneous

Popular On Elearnmarkets

  • Market Superheroes:
  • Vivek Bajaj
  • Chetan Panchamia
  • Ashish Kyal
  • Premal Parekh
  • Abhijit Paul
  • Jegan
  • Sivakumar Jayachadran
  • Vishal Malkan
  • Jyoti Budhia
  • Vivek Gadodia
  • Vishal Mehta
  • Piyush Chaudhry
  • Santosh Pasi
  • Gomathi Shankar
  • Market Superheroes:
  • Vivek Bajaj
  • Chetan Panchamia
  • Ashish Kyal
  • Premal Parekh
  • Abhijit Paul
  • Jegan
  • Sivakumar Jayachadran
  • Vishal Malkan
  • Jyoti Budhia
  • Vivek Gadodia
  • Vishal Mehta
  • Piyush Chaudhry
  • Santosh Pasi
  • Gomathi Shankar
  • Courses:​
  • Options Trading
  • Dow Theory
  • Momentum Trading
  • Stock Investing
  • Stock Market for Beginners
  • Harmonic Chart Patterns
  • Algo Trading
  • Elliot Wave Theory
  • Advanced Excel
  • Cryptocurrency
  • NSE Certification Course
  • Courses:​
  • Options Trading
  • Dow Theory
  • Momentum Trading
  • Stock Investing
  • Stock Market for Beginners
  • Harmonic Chart Patterns
  • Algo Trading
  • Elliot Wave Theory
  • Advanced Excel
  • Cryptocurrency
  • NSE Certification Course
  • Webinars:
  • Bank Nifty Scalping
  • Intraday Trading Strategies
  • Options Trading Strategies
  • Options selling
  • Price Action
  • Relative Strength
  • Tax Planning
  • Options Buying
  • Growth Stocks
  • Portfolio Management
  • Relative Strength Index
  • Risk Management
  • Renko Charts
  • Crude Oil
  • Traders Psychology
  • Moving Average
  • Multibagger Stocks
  • Free Learning Modules:
  • Intraday Trading
  • Options Scalping
  • Swing Trading
  • Financial Modelling
  • RSI Indicator
  • Bollinger Bands
  • Pricing of Futures
  • Personal Finance
  • Initial Public Offerings (IPO)
  • Value Investing
  • Technical Indicators
  • Candlesticks
  • Chart Patterns
  • Option Greeks
  • ELSS Funds
  • Banking and Insurance
  • Real Estate
  • Gold
  • Book Summaries:
  • Rich Dad Poor Dad
  • Psychology of Money
  • The Intelligent Investor
  • The Richest Man in Babylon
  • Think and Trade Like a Champion
  • Value Investing and Behavioural Finance
  • Trading in the Zone
  • Learn to Earn
  • Book Summaries:
  • Rich Dad Poor Dad
  • Psychology of Money
  • The Intelligent Investor
  • The Richest Man in Babylon
  • Think and Trade Like a Champion
  • Value Investing and Behavioural Finance
  • Trading in the Zone
  • Learn to Earn
  • Tools:
  • CAGR Calculator
  • SIP Calculator
  • eLearnOptions
  • Future Value Calculator
  • Present Value Calculator
  • Atal Pension Yojana
  • Cost of Delay Calculator
  • Become a Crorepati
  • Tools:
  • CAGR Calculator
  • SIP Calculator
  • eLearnOptions
  • Future Value Calculator
  • Present Value Calculator
  • Atal Pension Yojana
  • Cost of Delay Calculator
  • Become a Crorepati

© 2023 Elearnmarkets. All Rights Reserved

  • Visit Elearnmarkets
  • Courses
  • Webinars
  • Financial Guides
  • Get Free Counselling
  • Visit Elearnmarkets
  • Courses
  • Webinars
  • Financial Guides
  • Get Free Counselling

Get Elearnmarkets App

No Result
View All Result
  • Article Categories
    • Basic Finance
    • Derivatives
    • Financial Planning
    • Fundamental Analysis
    • Technical Analysis
    • Marketshala
    • Miscellaneous
  • Language
    • Hindi
    • Bengali
    • English
  • Courses
  • Webinars
  • Stories

© 2020 Elearnmarkets All Rights Reserved

Guide to Basics of Stock Investing
Learn to interpret the financial performance and health of a company.
Download Now
Guide Book on Investing with ₹ 5000
Learn about the Basics of Investments and Finance in this Ebook.
Download Now
View Course Details
View Course Details