Dow Theory defines the rhythm of the market, he who has the eye to see it, and the mind to understand can also learn to play it successfully. Charles Dow(1851-1902) was the father of Technical Analysis and the discoverer of the Dow theory.
The theory lays down the guidelines to understand how the market moves. It is the foundation on which the monument of Technical Analysis stands today.
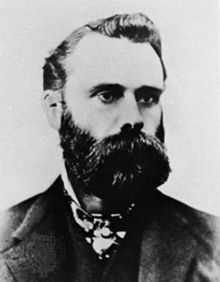
Dow was the creator of the first-ever market index, the Dow Jones Industrial Average (DJIA), created with the intent of measuring the movement of the US stocks. The term ‘Dow Theory’ was coined by A.C. Nelson, based on the writings of Charles Dow spread over a short span of only five years.
A book on the same was written by Williams Peter Hamilton called ‘ The Stock Market Barometer’ in 1922.
After this, the Dow Theory was further refined by Robert Rhea in his book, ‘The Dow Theory: An explanation of its development and an attempt to define its usefulness as an aid to speculation’.
| Table of Contents |
|---|
| What is Dow Theory? |
| What is Trends in Dow Theory? |
| Intersectoral Confirmations in Dow Theory |
| Importance of Volumes |
| Bottomline |
Rhea presented the following three hypotheses in his book :
- The primary trend is inviolate
- The average discounts everything.
- Dow Theory is not infallible
The primary trend in any market cannot be manipulated on any ground (like companies inflating their earnings temporarily to favorably affect their stock’s price). Thus, Dow believed that the primary trend should be the main focus of every serious investor.
The averages, or as we know them- the indices, discount everything.
In simple language, any news, information, valuation, even expectation with regards to the prices are reflected in the index price. Dow believed that market averages/indices foretold the upcoming scenario in industry and hence predicted the health of an economy.
The main emphasis of the Dow Theory is on extensive study and adopting a lack of emotional reaction to transactions.
Anyone who ignores these two ideas is the first to witness failure.
However, these hypotheses do not make the Dow Theory infallible. There are times when things don’t fall in the definitions spelled within Dow Theory.
What is Dow Theory?
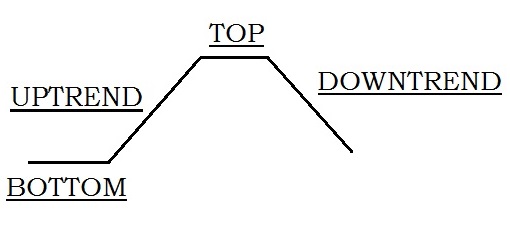
After the hypotheses, let’s look into the theorems. The first theorem of Dow is the ideal market picture consisting of the following main stages:
- Uptrend
- Top
- Downtrend
- Bottom
This is interspersed with corrections and consolidations. This is the general picture of the stock market over time and not the model of how it always is.
Also Read: Basic Toolkit for Stock Market Beginners
The second theorem relates to the Economic Rationale behind price movements.
The transaction in various sectors together constitutes economic activity.
Movement in prices of one sector/industry should be backed by movement in its supporting/ancillary industry.
For example, if the manufacturing getzonedup.com industry is showing a boom in terms of high production and sales, then the concerned logistics/transportation sector should also demonstrate a rise in business to reflect the disbursement of the produce in the economy.
The third theorem of Dow Theory is that prices move in trends. This means that most of the time there is a general direction that can be observed in the market prices.
What is Trends in Dow Theory?
Dow Theory is predominantly structured around the concept of trends in the market of study. There are three basic trends in price motions described within the Dow Theory, each defined against time:
Also Read: Gap Theory in Technical Analysis
The Primary Trend
It is the broad upward or downward movement in the price, known as the bull or the bear market, lasting for several years. The primary trend represents the overall, broad, and long-term movement in the market.
In the case of an uptrend, it is called the “Primary bull trend” and in the case of a downtrend, it is called the “Primary bear trend”. The primary trend is the most refined in terms of stages and can be observed not just in charts but also in the state of economy and business cycles.
In a Primary Bull Trend, the three stages are:
- Revival of confidence: From the prior primary bear trend
- Response: To increased corporate earning and improving economic conditions.
- Over-confidence: The belief that the market will never turn down, leading to rampant speculation and price rises based on hopes and speculations, ending with bursting of bubbles (sharp reversals), or gradual topping out of the market.
The three defined stages of the Primary Bear Trend are:
- Abandonment of hope: Post the failure of prices to rise higher and forming a deciding top on charts, the participants finally stop forcing money into the market and give up on speculation, eliminating the weakest participants who entered the market at the price tops.
- Selling on decreased earnings: As results of companies churn out lower and lower earnings, selling and unloading of stocks push the prices lower.
- Panic: Or distressed selling from those who believe that the worst is yet to come or are forced to liquidate.
The Secondary (Intermediate) Trend:
It is considered to be the most deceptive of the trends. The intermediate trend is of time duration shorter than the primary trend and unfolds as the reactionary movements within the primary trend.
They have a span of a minimum of three weeks and up to several months. This trend is like a rest for the primary trend, it has a similar effect for the primary trend as tugging on a catapult before being released, it corrects or pulls back nearly 33-66% from the last primary movement.
Just like the catapult shoots forward after being released, similarly, the primary trend also continues higher/deeper after the completion of the Intermediate trend.
Though success in reading the intermediate trend can result in higher profits, Dow believed that trying to interpret the intermediate trend was dangerous because the characteristics of an intermediate trend and a primary trend reversal are the same.
Often what truly is a trend reversal may be mistaken for another correction, or an intermediate trend may be mistaken for the end of a primary trend.
The Minor Trend
This is the daily fluctuations, considered unimportant in Dow Theory as it is subject to manipulation and disruption by ‘market noise’. When the concept of the Dow Theory had materialized and penned down by its founders, there was nothing but disregard for the Minor trend and the day-to-day movement of prices.
Today’s obsession with a minute to minute trading was probably not even factored at that time. However, this does not change what has been told about the Minor trend.
It remains erratic and fairly unpredictable even today.
Intersectoral Confirmations in Dow Theory
In the three hypotheses discussed above, we spoke about the importance of the economic rationale behind the movement of prices. In line with that, a price trend in one average or in the sector should be confirmed by a corresponding move in another sector.
Dow had formulated two main averages, the Dow Jones Industrial and Transport Averages (DJIA and DJTA) to gauge the state of economy and business. An advance in one average necessitated movement in another average.
For example – If the industrial average makes new highs and trends upwards then it is necessary that the transportation average also does the same in confirmation to it.
The absence of such confirmation indicates weakening of the overall market and may even lead to the revelation of bubbles (overvaluation of assets).
Importance of Volumes
Volumes play a very important role in confirming a trend. During trend reversals, it provides secondary confirmation after prices. When prices are very high and have witnessed a prolonged uptrend, then we can observe a falling trend in volumes while the prices rally and increasing volumes on declines in price.
This indicates an over-bought market. Conversely, extremely low prices with low volume on declines and high volume on rallies suggest an oversold market.
You can get a more clear idea of Dow theory by watching the video below:
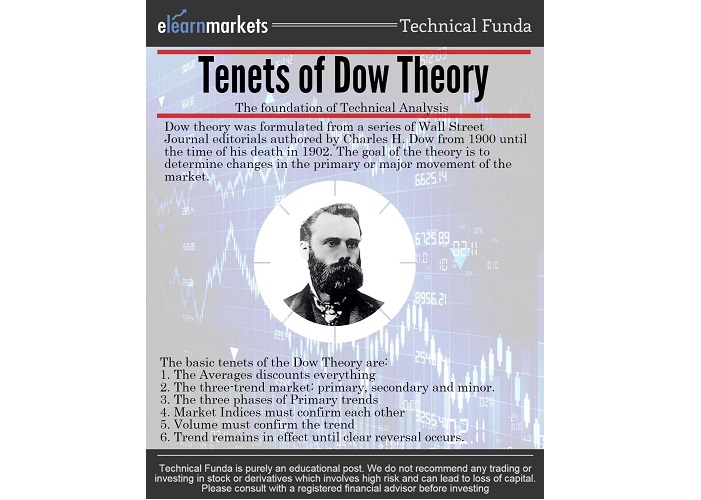
What are 6 tenets of Dow Theory ?
The above information about the Dow Theory can simply be represented as the ‘6 tenets of Dow Theory:
- Market moves in summation of three trends
(1)The PRIMARY TREND- can be as long as years and it is the ‘main movement’ of the market.

(2) The INTERMEDIATE TREND- lasting between 3 weeks to several months, retraces the last primary move some 33-66% and is difficult to decipher.
(3)The MINOR TREND- is least reliable, lasting from a few hours to several days, constitutes noise in the market, and may be subject to manipulation.
These three trends act instantaneously wherein the minor trend may be in a bear move, the intermediate may be in a bull move or the intermediate trend may be in a bear move and the primary may be in a bull move.
2. Market trends have three phases
Be it the bull trend or the bear trend, either way, there are three well-defined phases for each.
For the uptrend, the phases are Revival of confidence (accumulation ), Response (public participation) , Over-confidence (Speculation).
The three defined stages of the Primary Bear Trend are Abandonment of Hope (Distribution), Selling on decreased earnings (doubting), Panic ( distressed selling )
3. All news is discounted in the stock market
Prices know it all. All possible information and expectations are factored into prices beforehand.
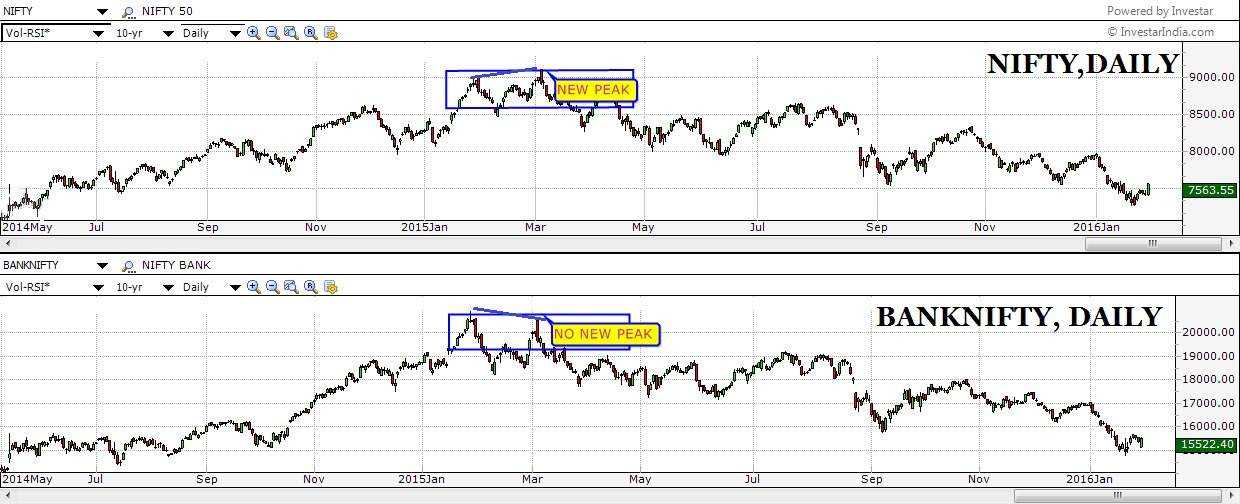
4. Averages must confirm
Initially, when the US was a growing industrial power, Dow had formulated the two averages.
One would reflect the state of manufacturing and the other, the movement of those products in the economy.
The logic was, that if there is production, then those who move them about should also be benefiting and hence new peaks in the industrial average needed to be confirmed by the peaks in the transportation average.
Today, the roles have changed, but the relations remain among sectors and so does the necessity of confirmation.
5. Volumes confirm trends
Dow was of the belief that trends in prices could be confirmed by volumes.
When the movement in price was accompanied by high volumes, they would depict the ‘true’ movement of the prices.
6. Trends continue unless definitive reversals come about
Irrespective of the day-to-day erratic movement and market noise that may be witnessed in prices, Dow believed that prices moved in trends.
Reversals in trends are hard to predict unless it’s too late due to the nature and difference in magnitude of trends. However, a trend is believed to be in action unless definitive proofs of reversal emerge
Also Read: 6 Tenets of Dow Theory
Bottomline:
A better understanding of Dow Theory may help individuals to identify concealed trends and make better-informed decisions relating to their open positions.


Very informative article, very well written and easy to understand. Thanks for sharing such detailed explanation of Dow Theory.
I am always invstigating online for articles that can aid me. Thanks!
Very wonderful information can be found on website. “Often the test of courage is not to die but to live.” by Conte Vittorio Alfieri.