Dividend Ratios- A corporation pays dividends to its stockholders as a way of sharing profits with them. They are one way that investors can profit from their stock investments and are paid on a regular basis. Dividends may be given in the form of extra shares or as cash that may be withdrawn and reinvested or utilized as income. A stock dividend is the name given to this kind of payout.
All equities, however, do not offer dividends. You should especially consider dividend stocks, which you may have recently seen in the news, if you are interested in investing in dividends. This is due to the fact that dividend stocks can shield investors from the current high rate of inflation.
Purchasing dividend stocks can offer consistent growth and income flow without the burden of real estate ownership or compromising on the lower yields and returns of more cautious investments. An investor’s retirement years may become more financially secure with dividend stock income, which may even cover living expenses.
In today’s blog, let us discuss 4 Ratios to Evaluate Dividend Stocks-
4 Dividend Ratios to Evaluate Dividend Stocks
Here are 4 Dividend Ratios to Evaluate Dividend Stocks
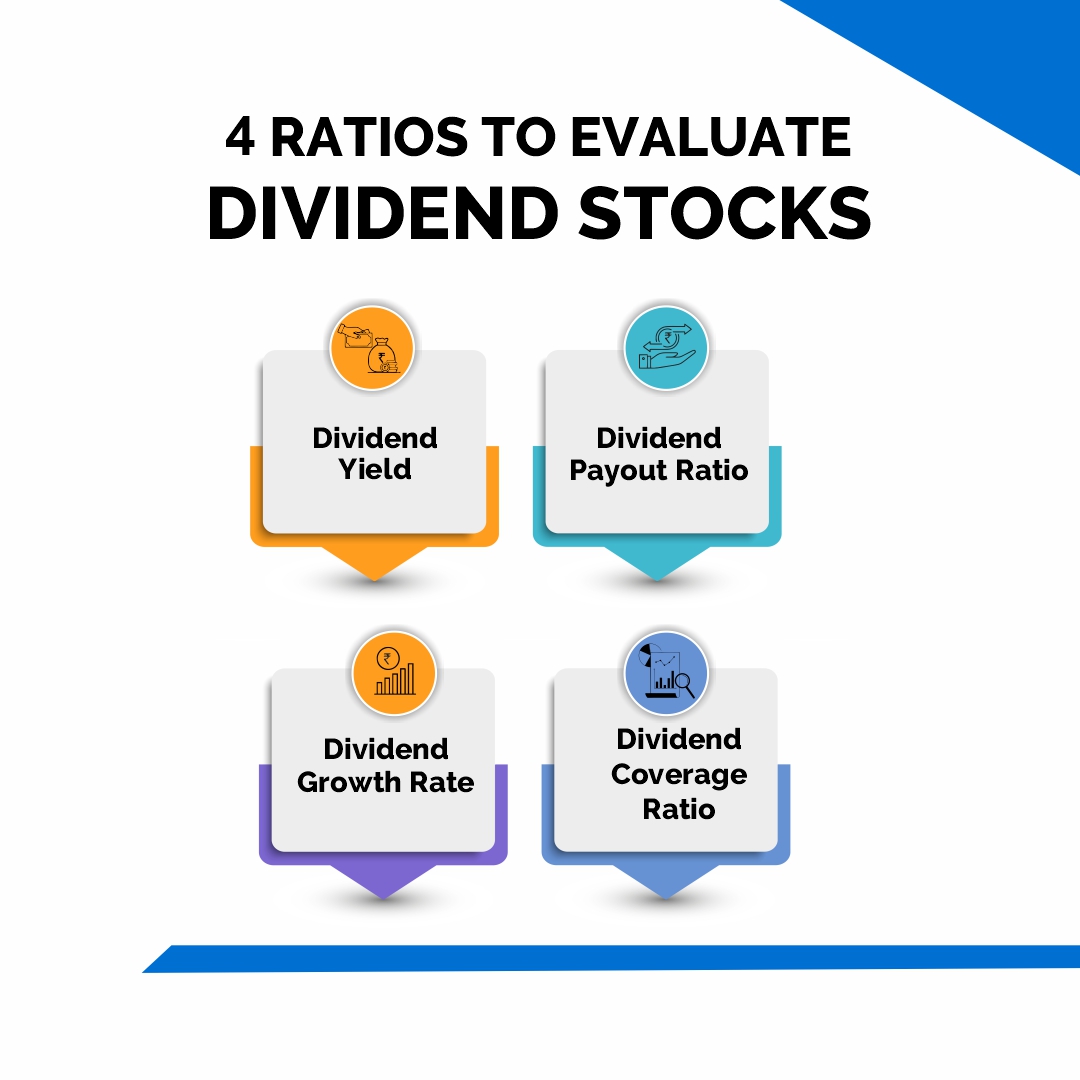
1. Dividend Yield
A ratio known as dividend yield indicates how much income you receive in dividends annually for each dollar you invest in stocks, mutual funds, or exchange-traded funds (ETFs).
Alternatively stated, dividend yield is the annual dividend payment of an investment represented as a percentage of its current price. The annual return on investment at the amount you paid for the security is indicated by this percentage yield.
Another reason it’s critical to comprehend dividend yield is that reinvesting your dividends rather than cashing them out can greatly increase your returns due to the power of compounding.
Although receiving more income per dollar invested makes a high dividend yield seem alluring, a high yield isn’t always a good idea. It can indicate that the company’s dividend payments have been growing faster than the company’s earnings or that the stock price of the company has been declining.
Calculation
Divide the total annual dividend amount of a stock or fund in dollars by the share price to find the dividend yield as shown below-
Dividend Yield = Dividends Per Share / Price Per Share
Assume a publicly traded corporation has a share price of Rs. 50 and pays Rs. 1.50 in dividends per share annually. Divide the dividend amount per share by the share price to find the dividend yield: 50 / 1.50 = 0.03.
If you translate the decimal to percentage, the dividend yield is 3.0%. This indicates that, provided the dividend payment stayed the same, an investment in the company’s stock at this price would yield 3% in dividends annually.
Interpretation
Although yields between 2% and 6% are typically regarded as good dividend yields, there are many other elements to take into account when determining if the yield on a company justifies an investment. What constitutes a good dividend return for you should also be heavily influenced by your personal investment objectives.
You might be trying to assemble an income-producing asset portfolio if you are retired or soon to be retired. This group of investors favours steady, long-term dividend returns that are sustainable.
2. Dividend Payout Ratio
The ratio of the total dividends paid to shareholders to the net income of the business is known as the dividend payout ratio. It is the portion of profits distributed as dividends to shareholders.
The business keeps the money that isn’t distributed to shareholders and uses it to settle debt or reinvest in its main business. There are instances when it is only called the payout ratio.
Calculation
The dividend payout ratio can be calculated as the yearly dividend per share divided by the earnings per share (EPS), or equivalently, the dividends divided by net income (as shown below).
Dividend Payout Ratio= Dividends Paid/Net Income
Interpretation
Interpreting the dividend payment ratio involves taking into account various factors, chief among them being the maturity level of the organization.
A young, growth-oriented business that wants to get bigger, create new products, and enter new markets is likely to be forgiven for having a low or even non-existent payout ratio since it will be expected to reinvest most or all of its earnings.
For businesses that do not pay dividends, the payout ratio is 0%; for businesses that distribute all of their net income as dividends, it is 100%.
3. Dividend Growth Rate
The percentage growth rate of a company’s dividend attained over a specific time period is known as the dividend growth rate, or DGR. The DGR is often computed on an annual basis. It can, however, also be computed on a quarterly or monthly basis if needed.
The dividend growth rate is a crucial indicator, especially when assessing the long-term viability of a business. Since dividends are paid out of the company’s profits, comparing the DGR over time allows one to evaluate and examine the company’s capacity to maintain profitability.
Calculation
Dividend growth rate can be computed using the compounded method computation or the arithmetic mean.
Interpretation
This idea might assist you in determining the potential earnings from a given company’s shares. Strong dividend growth numbers for the company over a period of years may indicate future dividend growth that is comparable. This would therefore suggest that your investment will be profitable over the long run.
Using the dividend discount model of stock valuation, you can quickly ascertain the intrinsic worth of companies in relation to their current market value once you are aware of the dividend growth rate.
In addition to calculating the yearly dividend rate growth, you may compute the growth rate for any interval using the mathematical methods.
4. Dividend Coverage Ratio
A financial indicator called dividend cover, or dividend coverage ratio, counts how many times a firm can distribute dividends to its shareholders. The ratio of the business’s net income to the dividend given to shareholders is known as the dividend coverage ratio.
The dividend coverage ratio shows how many times a business might use its net income during a given fiscal period to distribute dividends to its common shareholders. A higher dividend coverage ratio is generally better. Even while the dividend payout and coverage ratios are trustworthy indicators of dividend stock quality, investors should also consider the free cash flow to equity (FCFE).
Calculation
The general formula for calculating DCR is as follows:
Dividend Coverage Ratio = Net income / Dividend Declared
Interpretation
If the dividend coverage ratio is higher than 1, it means that the company’s earnings are sufficient to pay dividends to shareholders. Generally speaking, a DCR greater than 2 is regarded as favourable.
A declining DCR or a dividend cover that is continuously less than 1.5 should worry investors. A continually low or declining dividend cover could be an indication of future low business profitability and the inability of the company to continue paying dividends at the current rate.
Using Dividend Scans In StockEdge
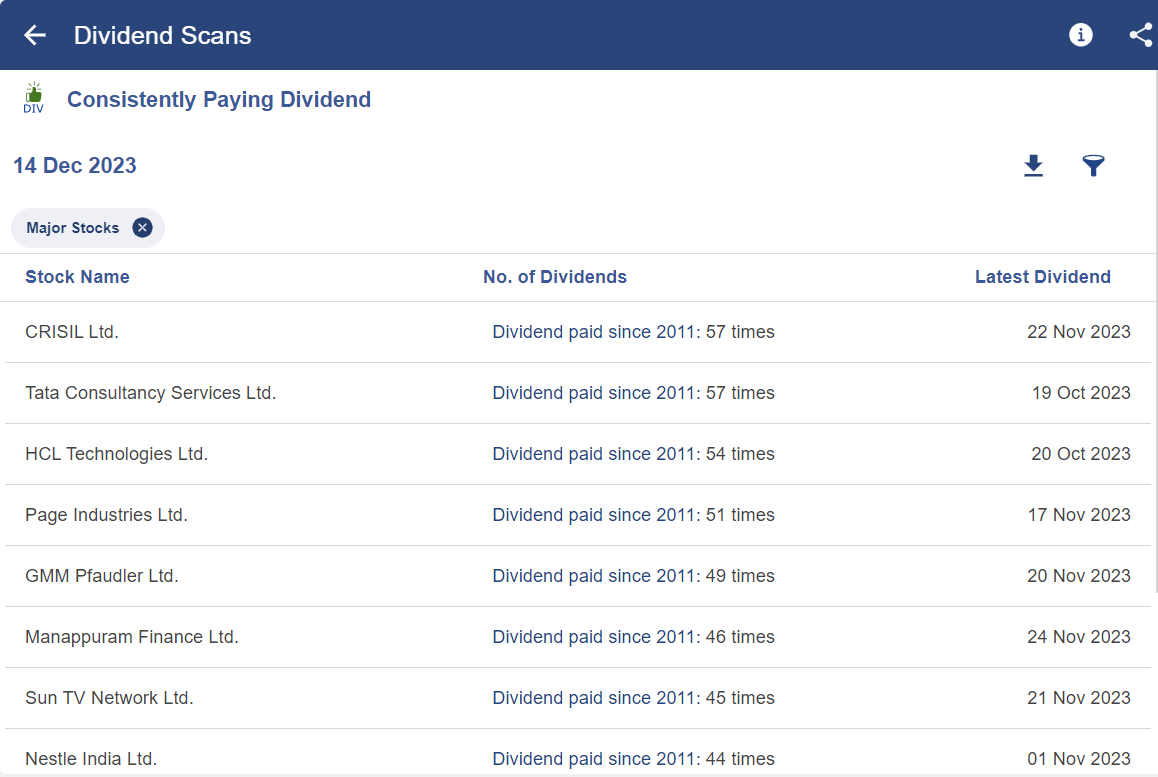
You can dividend scans in StockEdge to filter dividend stocks as shown below:
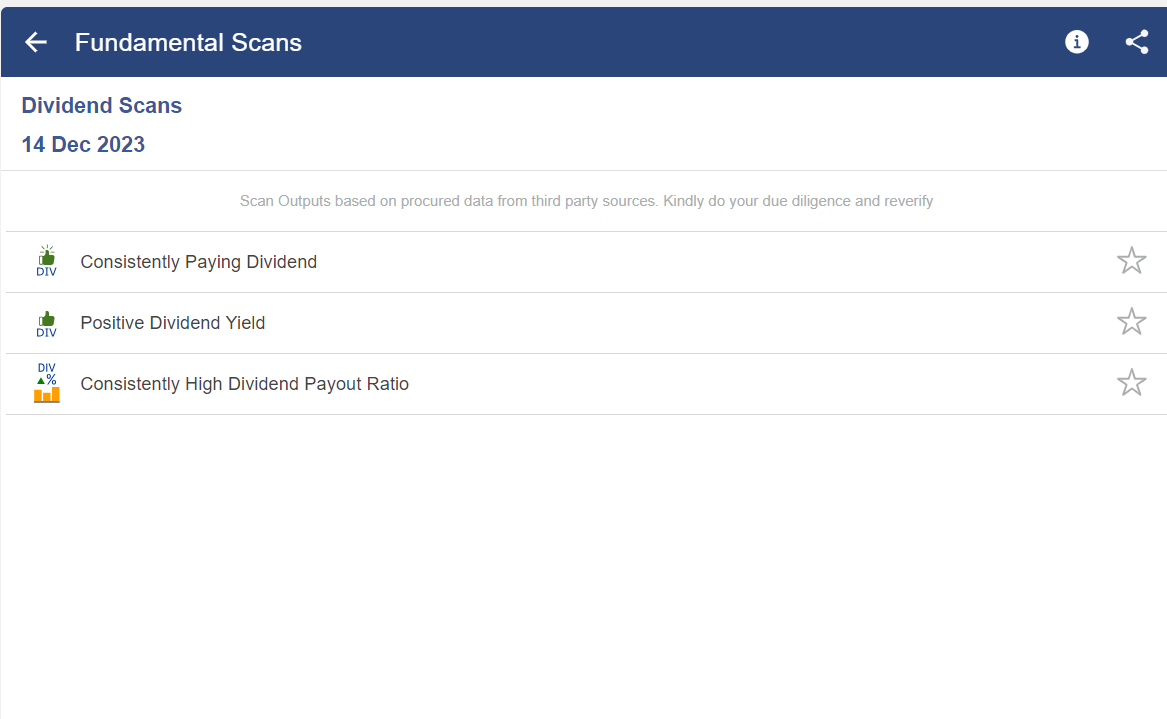
You will get a list of stocks that consistently pay dividends-
Bottomline
If an investor is seeking a consistent income from the stock market and has a somewhat lower risk tolerance, they should consider high dividend yield companies. Nonetheless, it is a well-known fact that businesses that offer large dividend payments have reached the apex of their capacity for growth and have little room to diversify. Consequently, for investors who are interested in fast-growing companies, investing in high dividend yield equities doesn’t make sense.
This is due to the fact that companies who are still experiencing rapid growth will reinvest their earnings rather than paying dividends to shareholders in order to grow even more. A word of caution: investors need to do their research and ensure that they completely understand the dangers associated with their investments and their personal risk profile.
Frequently Asked Questions (FAQs)
What are the different dividend ratios?
Dividend stock ratios are a useful tool for assessing a company's potential future dividend payments to shareholders. The dividend payout ratio, dividend coverage ratio, free cash flow to equity, and net debt to EBITDA are the four most widely used ratios.
What is the best dividend ratio?
A dividend payout ratio of between 30 and 50 percent is generally seen as healthy, whereas anything more than that might not be able to be sustained.
What is a good dividend coverage ratio?
A DCR of two is generally considered positive since it shows that a corporation can pay its dividends twice times. A DCR of less than 1.5 is considered concerning and may indicate the utilization of loans.


