Elearnmarkets - Financial Market Learning
  • Courses
  • Webinars
  • Stories
  • Language
    • English
    • Hindi
    • Bengali
No Result
View All Result
Get Free Course
  • Basic Finance
  • Derivatives
    • Futures
    • Options
  • Financial Planning
  • Fundamental Analysis
  • Technical Analysis
  • Mutual Funds
  • Marketshala
  • Miscellaneous
Elearnmarkets - Learn Stock Market, trading, investing for Free
  • Courses
  • Webinars
  • Stories
  • Language
    • English
    • Hindi
    • Bengali
No Result
View All Result
Get Free Course
Elearnmarkets - Learn Stock Market, trading, investing for Free
No Result
View All Result
Home Technical Analysis
Technical Indicators

Technical Indicators – A Comprehensive Guide for Stock Traders

Elearnmarkets by Elearnmarkets
September 4, 2023
in Technical Analysis
Reading Time: 9 mins read
0
6.3k
VIEWS
Share on FacebookShare on XShare on WhatsApp

When it comes to the analysis of any investable financial instrument, we can do it in two ways that is fundamental analysis and technical analysis. Fundamental analysis is basically checking the financial background of the company through its financial statements while technical analysis involves forecasting of price movements using indicators, trends, patterns, and technical indicators. 

According to John Murphy “Technical analysis is a skill that improves with experience and study. Always be a student and keep learning”

Table of Contents
What is Technical Analysis?
What is Offered by Technical indicator?
Uses of Technical Indicators
Tips for Using Indicators
What are Leading Indicators?
  • What is Momentum Oscillator?
  • Advantages and Disadvantages of Leading Indicators
What are Lagging Indicators?
  • Advantages and Disadvantages of Lagging Indicators
The Challenge offered by Indicators
Bottomline

In this article let us discuss about technical indicators in detail

 What is Technical Analysis?

Technical Analysis is used to forecast price movements based on analysis of the past price movements. It analyzes current demand-supply of commodities, stocks, indices, futures or any tradable instrument. It involves putting stock information like prices, volumes and open interest on a chart and applying various patterns and indicators to it in order to assess the future price movements. We can use technical analysis for intraday, hourly, monthly and yearly basis.

 What is Offered by Technical indicator?

Technical Indicators are used by technical analysists to forecast the price movements based on different perspectives. It provides a different outlook on the directions of price movement of stocks. It also provides a different outlook on the strength of the price movement on a given time frame.

 Uses of Technical Indicators

Technical Indicators - A Comprehensive Guide for Stock Traders 1

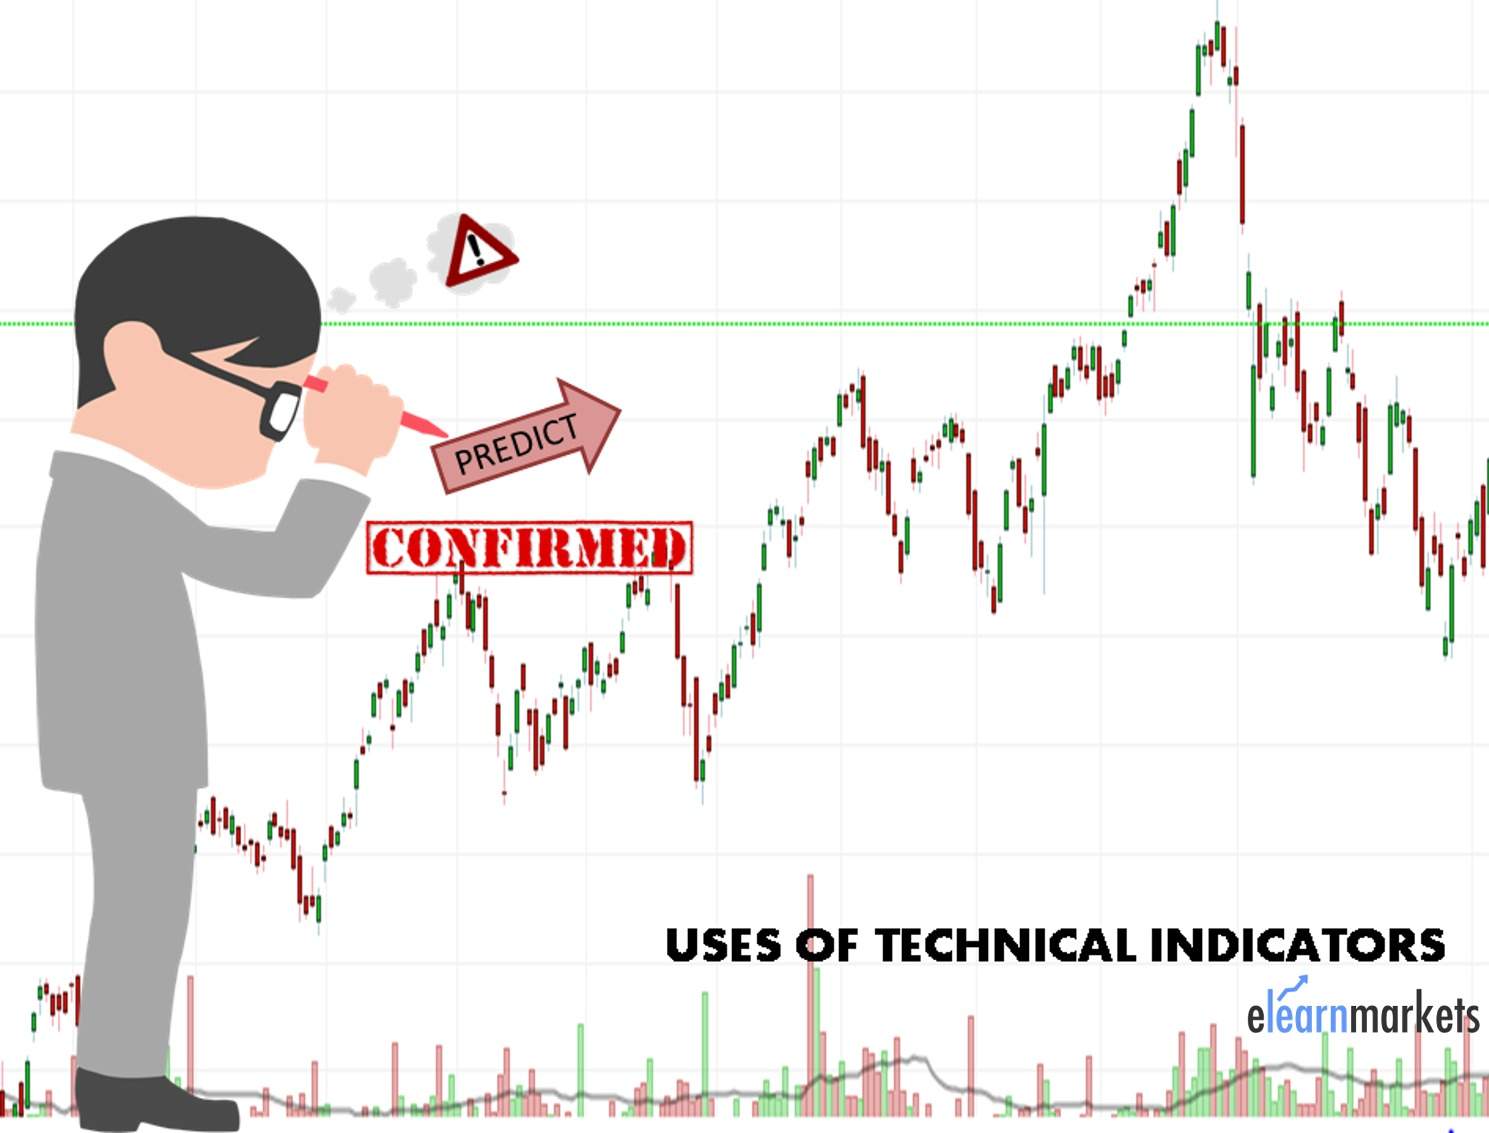
Technical Indicators are basically used:

  • To alert: Technical Indicators gives alerts or sometimes gives signals on the break out of support. Positive divergence act as an alert for the break out of resistance level.
  •  To confirm: Indicators can be used to confirm other technical tools such as candlesticks patterns on charts.
  • To predict: Technical Indicators can be used to predict future movements of the prices.

Tips for Using Indicators

 There are certain tips for using technical indicators. They are:

  • One Should Not Solely Rely On Indicators: There are many indicators which give buy and sell signals. But one should not rely on the indicators only. We should also focus on price movements. Indicators filter price actions with formulas. While applying indicators one should consider what the indicators are saying about the price actions.
  • Technical Indicators Should be read with other technical tools: The entry and exit points generated by the technical indicators should be read with candlesticks patterns and trends. Suppose technical indicators may generate a buy signal but candlesticks have formed a head and shoulder pattern and prices are going down.
  • One should not use more than five indicators: We should focus on only 2-3 indicators and not use multiple indicators together. If we use multiple indicators it will create confusion. Moreover, we should choose indicators that complement each other, instead of those that generate the same signals.

Learn to use technical indicators with Technical Trading Made Easy by Market Experts

 Suppose both Stochastic and Relative Strength Index both shows overbought and oversold regions. So it’s a waste of using both the indicators. We can see this from below picture:

Technical Indicators - A Comprehensive Guide for Stock Traders 2

What is Leading Indicator?

Indicators which give early signals of entry and exit are known as leading indicators. Leading indicators give us more opportunities to buy and sell. They represent a form of price momentum over a fixed look-back period, which is the number of periods used to calculate the indicator. Some of the popular leading indicators are:

  • Commodity Channel Index
  • Momentum Oscillator
  • Relative Strength Index
  • Stochastic
  • William %R

 What is Momentum Oscillator?

 Momentum refers to the rate of change or the speed of slope in which a stock increase or decrease.

An oscillator is an indicator that moves back and forth across a reference line. For example when we are driving a car in high speed, and due to some reason we have to stop the car so we press break, but the car does not stop at that point, it moves little forward and then stops.

 When an oscillator reaches a new high, it shows an uptrend and is likely to continue. When an oscillator shows a lower peak, it means that the trend has stopped accelerating and a reversal can be expected, much like a car slowing down to make a U-Turn.

Some of the Momentum Oscillators are:

  •  Relative Strength Index
  • Stochastic
  • William %R
  • Commodity Channel Index

 Advantages and Disadvantages of Leading Indicators

 One of the major advantages of the leading indicator is that it gives early signs of entry and exit than other indicators such as MACD. Leading Indicators also give us more opportunities to trade.

The drawback of the Leading Indicator is that sometimes it gives a false signal of buy and sell. Leading Indicators also do not identify trends, unlike the lagging indicators.

 What are Lagging Indicators?

Lagging Indicators are trend-following indicators. They do not predict early and exit points. They follow an event. Lagging Indicators tell us what prices are doing, whether they are increasing or decreasing and we can invest accordingly. They are basically trend-identifying indicators and tell us whether the prices are in the uptrend or downtrend. Examples of Lagging Indicators:

  • Moving Averages
  • MACD

 Advantages and Disadvantages of Lagging Indicators

The benefit of the lagging indicator is that it follows the trend and tells us whether the prices are in an uptrend or downtrend. The drawback of a lagging indicator is that it does not give early entry and exit points like a leading indicator.

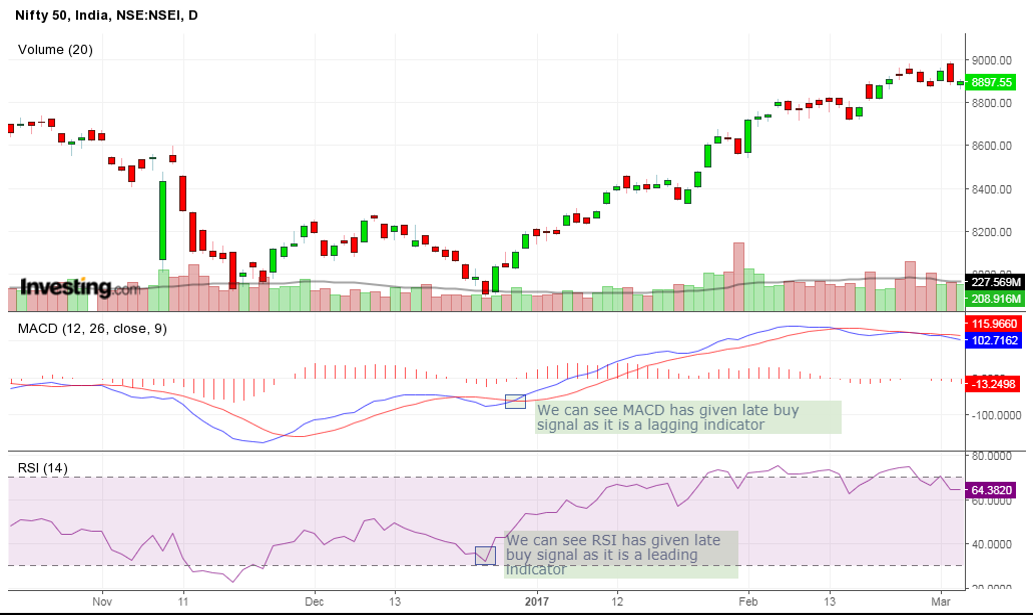
 The difference between the leading and lagging indicator can be seen in the chart below:

difference between leading and lagging

 The Challenge offered by Indicators

  • Open to Interpretation: Different people interpret indicators in the different ways. Even though there are standards of indicators, people look at it as different scenarios and come up with a different analysis. It depends upon how they look at the indicators. For example, different people will have different levels of supports and resistances. There is a saying that “Beauty lies in the eyes of beholders”, we can also say that analysis of these indicators lies in the eyes of beholders.
  • Always another level: People always wait for another level, even when a new trend arises they wait when the new trend will come. If they think they are bullish in some stock then there will be some indicator which will confirm there thinking.
  • Not all Signals Work: Signals generated by the indicators, will not always work. Suppose an indicator gives a sell signal but we should never be sure that the sell signal will work. We should look at the price actions. In the same way one indicator will never work for another stock in the same way. A 50-day moving average may work great to identify support and resistance for ITC, but a 70-day moving average may work better for TCS.
  • Sometimes the indicators give late signals: Sometimes the technical indicators give late signals. By the time the trend is identified, substantial moves have already taken place. The risk reward ratio also reduces due to late signals given by the indicators. 

Bottomline

Technical Analysis of stocks operates on the Pareto Principle which means it considers the market to be 80% psychological and 20% logical. Even though some principles and rules of technical analysis are universally applicable, it must be remembered that technical analysis is more an art form than a science. As an art form, it is subject to interpretation to become an expert in technical analysis, takes time, hard work and dedication.

Tags: english
ShareTweetSend
Get Kotak Offer Get Kotak Offer Get Kotak Offer
Previous Post

SEBI: Role, Objective, Structure and Functions of Securities and Exchange Board of India

Next Post

Impact of the Media on Intraday Trading

Elearnmarkets

Elearnmarkets

Elearnmarkets (ELM) is a complete financial market portal where the market experts have taken the onus to spread financial education. ELM constantly experiments with new education methodologies and technologies to make financial education effective, affordable and accessible to all. You can connect with us on Twitter @elearnmarkets.

Related Posts

Understand Slippage in Trading
Technical Analysis

What is Slippage in Trading? Meaning & Examples

March 28, 2025
297
Breakout trading strategies
Technical Analysis

Top 5 Breakout Trading Strategies

March 12, 2025
1.1k
5 stocks for today
Technical Analysis

5 Stocks to Buy Today That Could Beat the NIFTY in 2025!

May 5, 2025
398
Image describing What is marginal trading facility
Technical Analysis

 What is a Margin Trading Facility? Advantages & Risks

April 4, 2025
661

Leave a Reply Cancel reply

Your email address will not be published. Required fields are marked *

Disclaimer

Elearnmarkets (Kredent InfoEdge Pvt. Ltd.) is a SEBI-registered Research Analyst (RA) entity (SEBI Registration No.: INH300007493). The information provided in this article is for educational and informational purposes only and should not be considered as an offer to buy or sell any securities or investment products.

The stocks, securities, and investment instruments mentioned herein are not recommendations under SEBI (Research Analysts) Regulations, 2014. Readers are advised to conduct their own due diligence and seek independent financial advice before making any investment decisions.

Investments in securities markets are subject to market risks. Please read all related documents carefully before investing. Investing in Equity Shares,
Derivatives, Mutual Funds, or other instruments carry inherent risks, including potential loss of capital. Elearnmarkets (Kredent InfoEdge Pvt. Ltd.) does not provide any guarantee or assurance of returns on any investments. Past performance is not indicative of future performance.

Elearnmarkets Logo

Follow Us

Facebook-f X-twitter Instagram Linkedin-in Youtube Telegram

Register on Elearnmarkets

Continue your financial learning by creating your own account on Elearnmarkets.com

Register Free Account

Download App

Playstore logo
Download on app store

Categories

  • Basic Finance
  • Derivatives
  • Financial Planning
  • Fundamental Analysis
  • Technical Analysis
  • Mutual Funds
  • Miscellaneous

Popular On Elearnmarkets

  • Market Superheroes:
  • Vivek Bajaj
  • Chetan Panchamia
  • Ashish Kyal
  • Premal Parekh
  • Abhijit Paul
  • Jegan
  • Sivakumar Jayachadran
  • Jyoti Budhia
  • Vivek Gadodia
  • Vishal Mehta
  • Piyush Chaudhry
  • Santosh Pasi
  • Gomathi Shankar
  • Market Superheroes:
  • Vivek Bajaj
  • Chetan Panchamia
  • Ashish Kyal
  • Premal Parekh
  • Abhijit Paul
  • Jegan
  • Sivakumar Jayachadran
  • Jyoti Budhia
  • Vivek Gadodia
  • Vishal Mehta
  • Piyush Chaudhry
  • Santosh Pasi
  • Gomathi Shankar
  • Courses:​
  • Options Trading
  • Dow Theory
  • Momentum Trading
  • Stock Investing
  • Harmonic Chart Patterns
  • Algo Trading
  • Elliot Wave Theory
  • Advanced Excel
  • Cryptocurrency
  • NSE Certification Course
  • Courses:​
  • Options Trading
  • Dow Theory
  • Momentum Trading
  • Stock Investing
  • Harmonic Chart Patterns
  • Algo Trading
  • Elliot Wave Theory
  • Advanced Excel
  • Cryptocurrency
  • NSE Certification Course
  • Webinars:
  • Bank Nifty Scalping
  • Intraday Trading Strategies
  • Options Trading Strategies
  • Options selling
  • Price Action
  • Relative Strength
  • Tax Planning
  • Options Buying
  • Growth Stocks
  • Portfolio Management
  • Risk Management
  • Renko Charts
  • Crude Oil
  • Traders Psychology
  • Moving Average
  • Multibagger Stocks
  • Free Learning Modules:
  • Intraday Trading
  • Options Scalping
  • Swing Trading
  • Financial Modelling
  • RSI Indicator
  • Bollinger Bands
  • Pricing of Futures
  • Personal Finance
  • Initial Public Offerings (IPO)
  • Value Investing
  • Technical Indicators
  • Candlesticks
  • Chart Patterns
  • Option Greeks
  • ELSS Funds
  • Banking and Insurance
  • Real Estate
  • Gold
  • Book Summaries:
  • Rich Dad Poor Dad
  • Psychology of Money
  • The Intelligent Investor
  • The Richest Man in Babylon
  • Think and Trade Like a Champion
  • Value Investing and Behavioural Finance
  • Trading in the Zone
  • Learn to Earn
  • Book Summaries:
  • Rich Dad Poor Dad
  • Psychology of Money
  • The Intelligent Investor
  • The Richest Man in Babylon
  • Think and Trade Like a Champion
  • Value Investing and Behavioural Finance
  • Trading in the Zone
  • Learn to Earn
  • Tools:
  • CAGR Calculator
  • SIP Calculator
  • eLearnOptions
  • Future Value Calculator
  • Present Value Calculator
  • Atal Pension Yojana
  • Cost of Delay Calculator
  • Become a Crorepati
  • Tools:
  • CAGR Calculator
  • SIP Calculator
  • eLearnOptions
  • Future Value Calculator
  • Present Value Calculator
  • Atal Pension Yojana
  • Cost of Delay Calculator
  • Become a Crorepati

© 2025 Elearnmarkets. All Rights Reserved

  • Visit Elearnmarkets
  • Courses
  • Webinars
  • Financial Guides
  • Get Free Counselling
  • Visit Elearnmarkets
  • Courses
  • Webinars
  • Financial Guides
  • Get Free Counselling

Download Our App

No Result
View All Result
  • Article Categories
    • Basic Finance
    • Derivatives
    • Financial Planning
    • Fundamental Analysis
    • Technical Analysis
    • ETFs & Mutual Funds
    • Marketshala
    • Miscellaneous
  • Language
    • Hindi
    • Bengali
    • English
  • Courses
  • Webinars
  • Stories
Get Free Course

© 2024 Elearnmarkets All Rights Reserved

A Handbook of Technical Analysis
To start your trading journey as a seasoned technical analyst
Download Guide For FREE
Trading Day 2025