Nifty close 10147.6: Nifty opened near its lifetime high but ended on a subdued note as investor awaits Fed meeting for rate clues.
Hourly Technical:
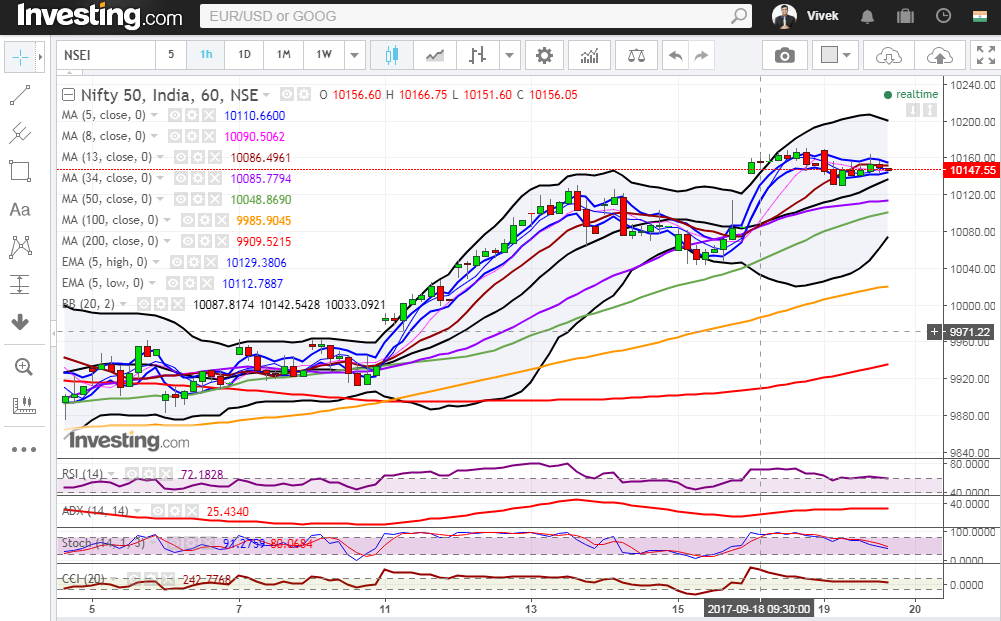
In the Hourly chart, Nifty consolidates at the top and ended marginally lower. The probable support in the hourly chart comes at 20 Hourly moving average (presently at approx. 10136.8) and 34 Hourly moving average (presently at approx.10114.1).
On the upside, Nifty may face resistance at upper Bollinger line (presently at approx. 10200.4).
Hourly CCI and Stochastic are in the normal zone while RSI is the overbought area. Moreover, rising ADX indicates gain of momentum. Overall Nifty remains Bullish to neutral in Hourly timeframe.
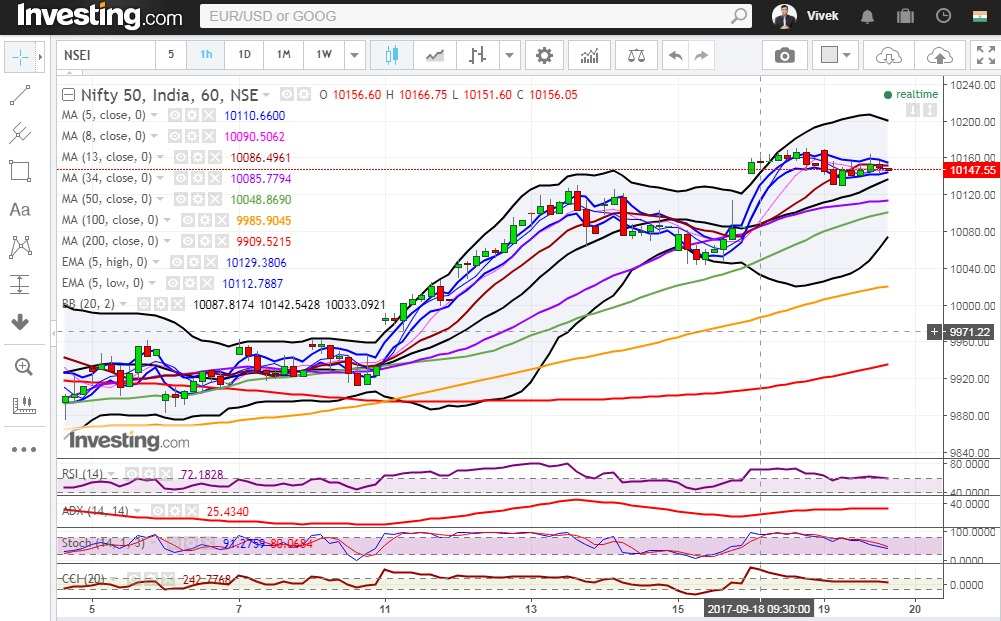
Figure: Hourly Chart
Daily Technical:
In the daily chart, Nifty closes above all short term moving average and goes into hibernation mode before Fed meeting. The probable support in the daily chart comes at 5 Day High EMA (presently at approx.10135.8) and 5 DMA (presently at approx.10110.4).
On the upside, Nifty may face resistance at upper Bollinger line (presently at approx. 10182.3).
Daily Stochastic, RSI and CCI are in overbought zone and Daily ADX has finally turned up thus indicating gain in momentum. Overall Nifty remains Bullish in Daily timeframe.

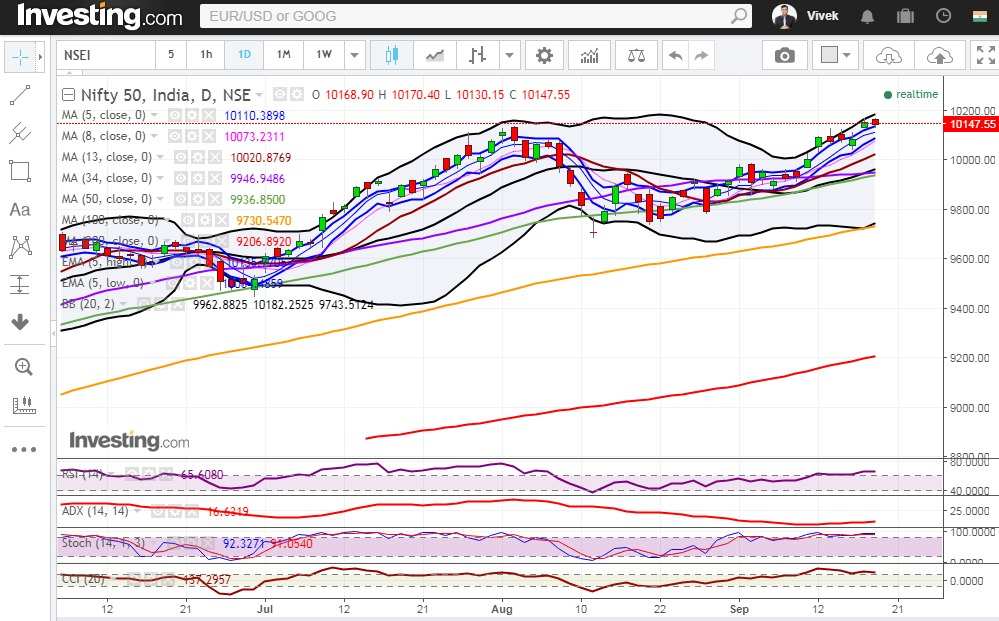
Figure: Daily Chart
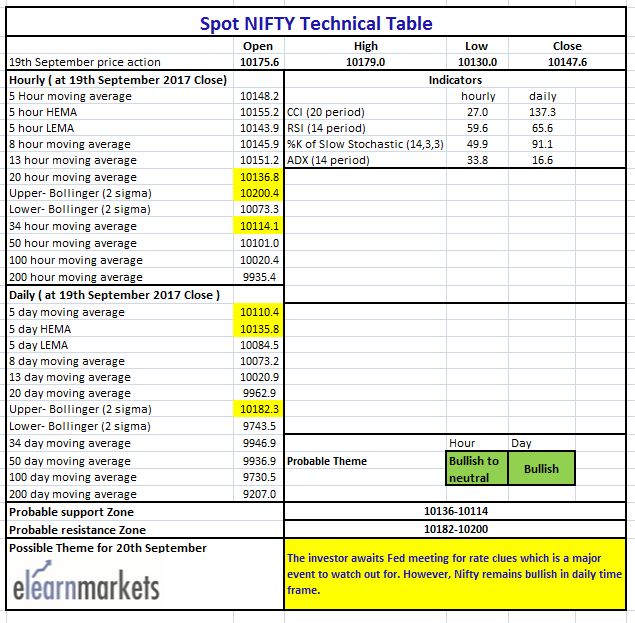
Figure: Tech Table


