Elearnmarkets - Financial Market Learning
  • Courses
  • Webinars
  • Stories
  • Language
    • English
    • Hindi
    • Bengali
No Result
View All Result
Get Free Course
  • Basic Finance
  • Derivatives
    • Futures
    • Options
  • Financial Planning
  • Fundamental Analysis
  • Technical Analysis
  • Mutual Funds
  • Marketshala
  • Miscellaneous
Elearnmarkets - Learn Stock Market, trading, investing for Free
  • Courses
  • Webinars
  • Stories
  • Language
    • English
    • Hindi
    • Bengali
No Result
View All Result
Get Free Course
Elearnmarkets - Learn Stock Market, trading, investing for Free
No Result
View All Result
Home Fundamental Analysis
Banking Sector - What Solvency & Liquidity Ratio means for a bank? 1

Banking Sector – What Solvency & Liquidity Ratio means for a bank?

Elearnmarkets by Elearnmarkets
May 28, 2024
in Fundamental Analysis, Financial Statement Analysis
Reading Time: 8 mins read
0
29.7k
VIEWS
Share on FacebookShare on XShare on WhatsApp

Financial ratios are widely used to analyze a bank’s performance, specifically to gauge and benchmark the bank’s level of solvency and liquidity.

These financial ratios should be used before investing in the banks.

Liquidity and Solvency play an imperative role in the smooth survival of the banking sector.

These are some of the fundamental factors in the maintenance of the bank’s financial viability. This is a vital parameter on which a bank is analyzed.

Table of Contents
What are Banking Sector Ratios
Solvency Ratio
  • Debt to Equity Ratio
  • Financial leverage
  • Capital Adequacy Ratio
Liquidity Ratio
  • Credit to Deposit Ratio
  • CASA Ratio
  • Interest Expended to Total Funds
  • Current ratio
  • Cash ratio

Liquidity is the ability of a bank to increase the assets and meet obligations as and when they come due, without incurring any losses.

Solvency of the bank refers to the ability of the bank to meet long-term obligations as and when they arise.

What are Banking Sector Ratios ?

Banking Sector

In the most lucid way, solvency measures the long-term position of the bank, and liquidity measures the short-term position of the bank.

Both of these parameters are important for the banking sector to function smoothly:
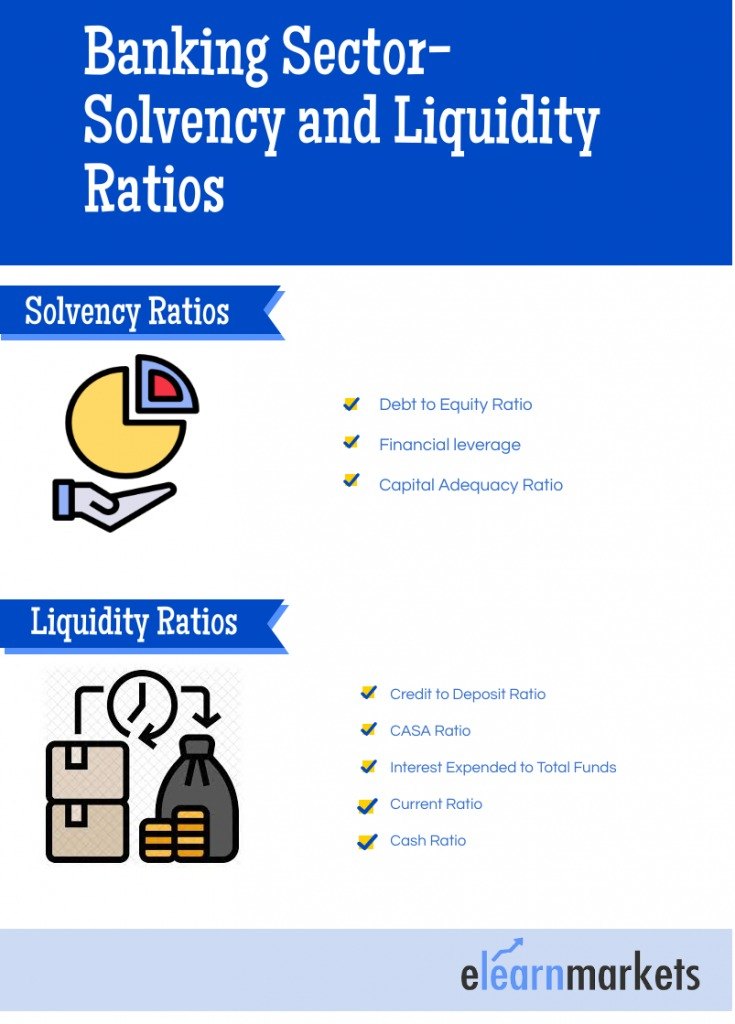
Solvency Ratio

The solvency ratio measures the long-term ability of the bank to meet its obligations. This involves understanding the capacity of the bank to meet its obligations.

1. Debt to Equity Ratio:

The financial business is a leveraged business and hence this will be high.

So for the banking sector, this ratio will be high, and therefore the most prudent manner to analyze the bank on this parameter will be to compare it with its peers.

This will give a clear understanding of the debt in comparison to its peers.

2. Financial leverage:

Financial leverage is the ratio of a bank’s total debt to its total assets. It implies the amount of assets in comparison to its debt.

In the banking sector analysis, it is of utmost importance in understanding the banks Business strength. As lending is one of the most important businesses of the Banks.

Learn theory & principles of Macroeconomics with Macroeconomics Made Easy Course by Market Experts

3. Capital Adequacy Ratio:

This ratio helps understand the amount of losses the bank can absorb before becoming insolvent.

It is a measurement of a bank’s available capital expressed as a percentage of a bank’s risk-weighted credit exposure.

Here are the ratios of HDFC Bank and Kotak Mahindra Bank.

ParticularsHDFC BankKotak Mahindra Bank
Capital Adequacy Ratio17.117.5
Debt to equity0.781.14

Also in the banking sector analysis, Provisions is a very important item which needs to be analysed under both short and long term impact on the books.

This basically implies the conservatism with which the bank is performing its operations and its strength to absorb any sudden and also deemed hit on the financials.

Thus a rising provision means that the bank expects some hit on its financials so has increased provisions and vice versa.

Liquidity Ratio

Liquidity measures the short-term ability of the bank to operate and function.

There are a few banking sector ratios that can be computed to analyse the liquidity of the bank while analyzing banking stocks.

1. Credit to Deposit Ratio:

This measures the bank’s total credit in relation to its total deposits in the bank. This helps in analyzing the bank’s liquidity position.

This should be neither too high nor too low, hence a balance must be strike between the % to be maintained.

As a ratio, more than 100 would mean that the bank has lent more than it has received as deposits

2. CASA Ratio:

CASA stands for current account and saving account.

CASA ratio measures the ratio of deposits in current and savings account as a % of total deposits.

The higher the ratio, the lower is the cost of funds for the bank which significantly helps the banks in reducing operating expenses.

3. Interest Expended to Total Funds:

The interest expense is the amount paid on the deposits accepted by the bank. It tells us about the cost of funds with respect to deposits.

Interest expense is a non-operating expense shown in the income statement. It represents interest payable on any borrowings such as bonds, loans, convertible debt, or lines of credit.

Suggested Read – 7 Ratios to check before Investing in Banks

Here is a list of different ratios of two of the leading banks HDFC Bank and Kotak Mahindra Bank as of FY19.

ParticularsHDFC BankKotak Mahindra Bank
Credit to deposits88.7691.06
CASA42.3852.50
Interest expended to total funds4.084.06

4. Current ratio-

This ratio measures the ability of the bank to meet its current liabilities in relation to its current assets.

This implies the day-to-day liquidity which the bank possesses for its functioning. This ratio when greater than 1 is viewed as the liquid to meet its current obligations.

5. Cash ratio-

The cash ratio is the ratio of cash to banks’ total liabilities. This ratio implies the cash which the bank holds.

This ratio determines the credit which can be created from the deposits.

This ratio if high will imply the bank is less profitable and if low will imply the bank is risky.

Hence the right balance is required to make the bank liquid to let its activities function smoothly.

For Instance, the cash balance of the bank gives a sense of the liquidity the bank holds in terms of cash.

You can check these ratios and invest in the banks accordingly from the StockeEdge web version.

Key Takeaways:

  • Solvency ratio is analyzed to determine the long term ability of the bank to meet its obligations
  • Liquidity ratio is analyzed to determine the short term ability of the bank to meet its obligations
  • Banks are a leveraged business and hence their ability in both short term and long term should be carefully analyzed.
  • This position of the banking sector should be analyzed both on a standalone bank basis and also in comparison to its peers to have a better understanding of the current situation in the sector as a whole.

Happy Learning!

Tags: banking sectorenglishintermediateratio analysis
ShareTweetSend
Get Kotak Offer Get Kotak Offer Get Kotak Offer
Previous Post

রাইট ইস্যু শেয়ারে কি বিনিয়োগ করা উচিত?

Next Post

Trailing Stop Loss – Working, Techniques, Pros & Cons

Elearnmarkets

Elearnmarkets

Elearnmarkets (ELM) is a complete financial market portal where the market experts have taken the onus to spread financial education. ELM constantly experiments with new education methodologies and technologies to make financial education effective, affordable and accessible to all. You can connect with us on Twitter @elearnmarkets.

Related Posts

Top 5 Valuation Ratios in the Stock Market 2
Fundamental Analysis

Top 5 Valuation Ratios in the Stock Market

May 5, 2025
849
price to sales ratio
Fundamental Analysis

Price to Sales Ratio: A Key Metric for Understanding Company Value

May 5, 2025
453
Gearing Ratio
Fundamental Analysis

What Is the Gearing Ratio? Formula & Calculation

December 3, 2024
1.2k
Top 5 Fundamental Analysis Tools 3
Fundamental Analysis

Top 5 Fundamental Analysis Tools

January 31, 2025
4.1k

Leave a Reply Cancel reply

Your email address will not be published. Required fields are marked *

Disclaimer

Elearnmarkets (Kredent InfoEdge Pvt. Ltd.) is a SEBI-registered Research Analyst (RA) entity (SEBI Registration No.: INH300007493). The information provided in this article is for educational and informational purposes only and should not be considered as an offer to buy or sell any securities or investment products.

The stocks, securities, and investment instruments mentioned herein are not recommendations under SEBI (Research Analysts) Regulations, 2014. Readers are advised to conduct their own due diligence and seek independent financial advice before making any investment decisions.

Investments in securities markets are subject to market risks. Please read all related documents carefully before investing. Investing in Equity Shares,
Derivatives, Mutual Funds, or other instruments carry inherent risks, including potential loss of capital. Elearnmarkets (Kredent InfoEdge Pvt. Ltd.) does not provide any guarantee or assurance of returns on any investments. Past performance is not indicative of future performance.

Elearnmarkets Logo

Follow Us

Facebook-f X-twitter Instagram Linkedin-in Youtube Telegram

Register on Elearnmarkets

Continue your financial learning by creating your own account on Elearnmarkets.com

Register Free Account

Download App

Playstore logo
Download on app store

Categories

  • Basic Finance
  • Derivatives
  • Financial Planning
  • Fundamental Analysis
  • Technical Analysis
  • Mutual Funds
  • Miscellaneous

Popular On Elearnmarkets

  • Market Superheroes:
  • Vivek Bajaj
  • Chetan Panchamia
  • Ashish Kyal
  • Premal Parekh
  • Abhijit Paul
  • Jegan
  • Sivakumar Jayachadran
  • Jyoti Budhia
  • Vivek Gadodia
  • Vishal Mehta
  • Piyush Chaudhry
  • Santosh Pasi
  • Gomathi Shankar
  • Market Superheroes:
  • Vivek Bajaj
  • Chetan Panchamia
  • Ashish Kyal
  • Premal Parekh
  • Abhijit Paul
  • Jegan
  • Sivakumar Jayachadran
  • Jyoti Budhia
  • Vivek Gadodia
  • Vishal Mehta
  • Piyush Chaudhry
  • Santosh Pasi
  • Gomathi Shankar
  • Courses:​
  • Options Trading
  • Dow Theory
  • Momentum Trading
  • Stock Investing
  • Harmonic Chart Patterns
  • Algo Trading
  • Elliot Wave Theory
  • Advanced Excel
  • Cryptocurrency
  • NSE Certification Course
  • Courses:​
  • Options Trading
  • Dow Theory
  • Momentum Trading
  • Stock Investing
  • Harmonic Chart Patterns
  • Algo Trading
  • Elliot Wave Theory
  • Advanced Excel
  • Cryptocurrency
  • NSE Certification Course
  • Webinars:
  • Bank Nifty Scalping
  • Intraday Trading Strategies
  • Options Trading Strategies
  • Options selling
  • Price Action
  • Relative Strength
  • Tax Planning
  • Options Buying
  • Growth Stocks
  • Portfolio Management
  • Risk Management
  • Renko Charts
  • Crude Oil
  • Traders Psychology
  • Moving Average
  • Multibagger Stocks
  • Free Learning Modules:
  • Intraday Trading
  • Options Scalping
  • Swing Trading
  • Financial Modelling
  • RSI Indicator
  • Bollinger Bands
  • Pricing of Futures
  • Personal Finance
  • Initial Public Offerings (IPO)
  • Value Investing
  • Technical Indicators
  • Candlesticks
  • Chart Patterns
  • Option Greeks
  • ELSS Funds
  • Banking and Insurance
  • Real Estate
  • Gold
  • Book Summaries:
  • Rich Dad Poor Dad
  • Psychology of Money
  • The Intelligent Investor
  • The Richest Man in Babylon
  • Think and Trade Like a Champion
  • Value Investing and Behavioural Finance
  • Trading in the Zone
  • Learn to Earn
  • Book Summaries:
  • Rich Dad Poor Dad
  • Psychology of Money
  • The Intelligent Investor
  • The Richest Man in Babylon
  • Think and Trade Like a Champion
  • Value Investing and Behavioural Finance
  • Trading in the Zone
  • Learn to Earn
  • Tools:
  • CAGR Calculator
  • SIP Calculator
  • eLearnOptions
  • Future Value Calculator
  • Present Value Calculator
  • Atal Pension Yojana
  • Cost of Delay Calculator
  • Become a Crorepati
  • Tools:
  • CAGR Calculator
  • SIP Calculator
  • eLearnOptions
  • Future Value Calculator
  • Present Value Calculator
  • Atal Pension Yojana
  • Cost of Delay Calculator
  • Become a Crorepati

© 2025 Elearnmarkets. All Rights Reserved

  • Visit Elearnmarkets
  • Courses
  • Webinars
  • Financial Guides
  • Get Free Counselling
  • Visit Elearnmarkets
  • Courses
  • Webinars
  • Financial Guides
  • Get Free Counselling

Download Our App

No Result
View All Result
  • Article Categories
    • Basic Finance
    • Derivatives
    • Financial Planning
    • Fundamental Analysis
    • Technical Analysis
    • ETFs & Mutual Funds
    • Marketshala
    • Miscellaneous
  • Language
    • Hindi
    • Bengali
    • English
  • Courses
  • Webinars
  • Stories
Get Free Course

© 2024 Elearnmarkets All Rights Reserved

Guide to Basics of Stock Investing
Learn to interpret the financial performance and health of a company.
Download Guide For FREE
How to Build a Winning Trading System in Any Market Condition