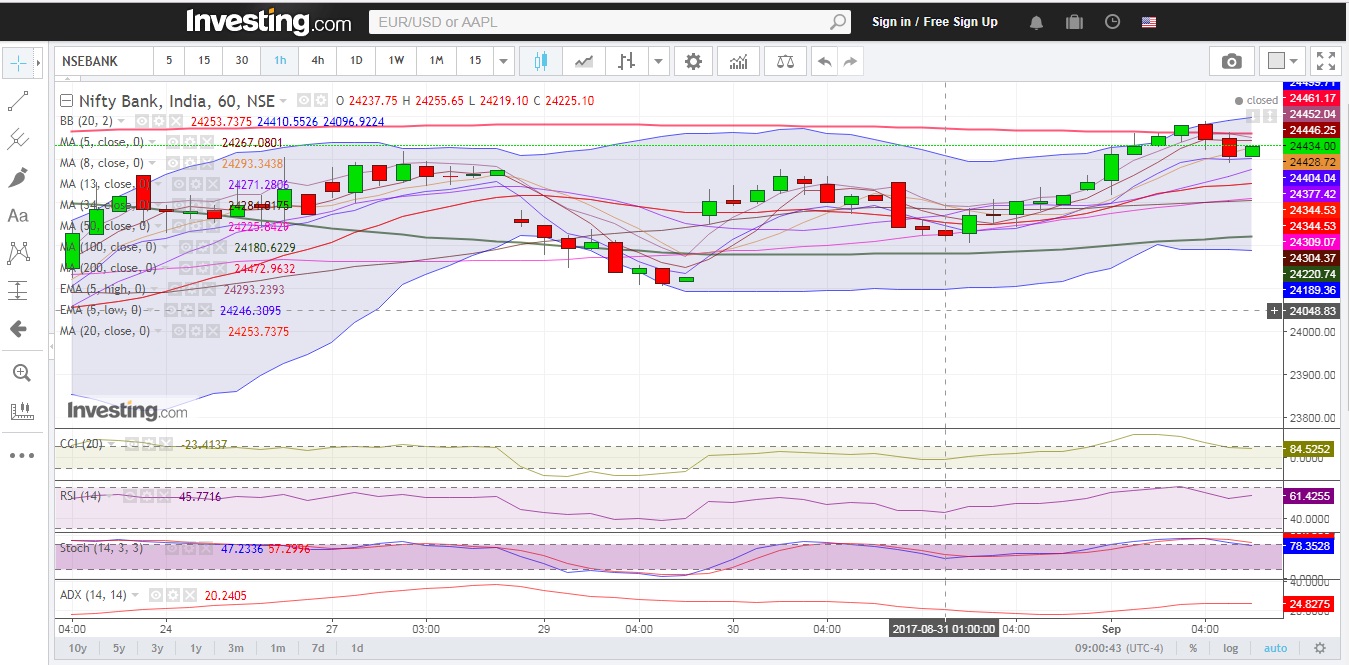
Bank Nifty opened above the 20 DMA mark (24326 approx) today the 1st of September.
The Index traded in a range of 172 points throughout the day and closed marginally below the 34 DMA of (24404 approx)
Hourly Technicals:
In the Hourly Chart, Bank Nifty has closed around its 5 Hour High DMA of (24446 approx).
The Index is likely to face immediate resistance around the 5 Hour High EMA (24499 approx) mark.
Bank Nifty has to close convincingly above 24500 for the Bulls to retain the stakes in their favor.
Hourly RSI and CCI are close to the higher end of their normal range.
The hourly ADX is indicating that Bank Nifty is picking up momentum.
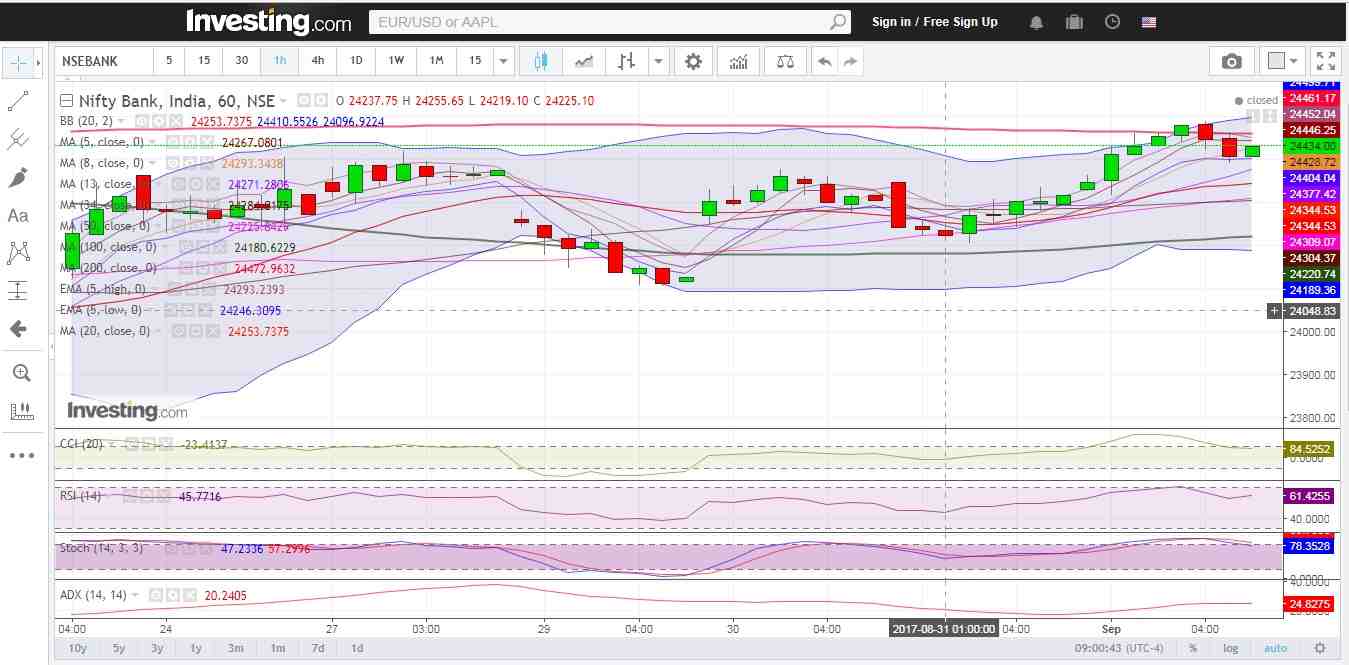
Figure: Hourly Chart
Daily Technicals:
The daily chart indicates that Bank Nifty has closed above the 34 DMA of (24404 approx).
If the Index breaks above the 24496 mark, the next resistance will be 25005.
On the downside, however, if Bank Nifty breaks and closes below its 5 Day Low EMA (24207 approx), it could find support at the 100 MA area (23419 approx).
While the daily RSI and CCI indicator has closed marginally above its normal range.
The ADX has closed towards the lower end of its normal range.
Become a technical analysis expert by joining NSE Academy Certified Technical Analysis course on Elearnmarkets.
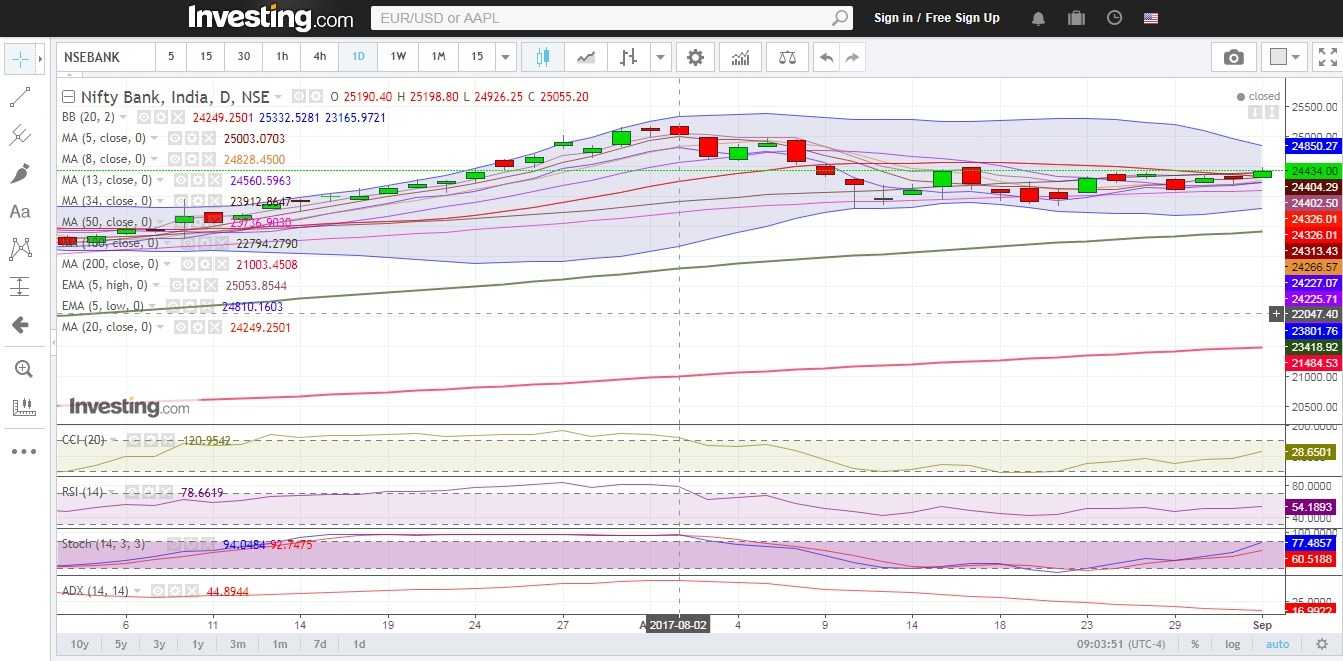
Figure: Daily Chart
Weekly Technicals:
In the weekly timeframe Bank Nifty has opened above the 8 weekly Moving Average (24325 approx).
The Index will find its next resistance around the higher end of its weekly Bollinger Band (25180 approx).
Bank Nifty is likely to find its next support below the 13 weekly Moving Average (23822 approx).
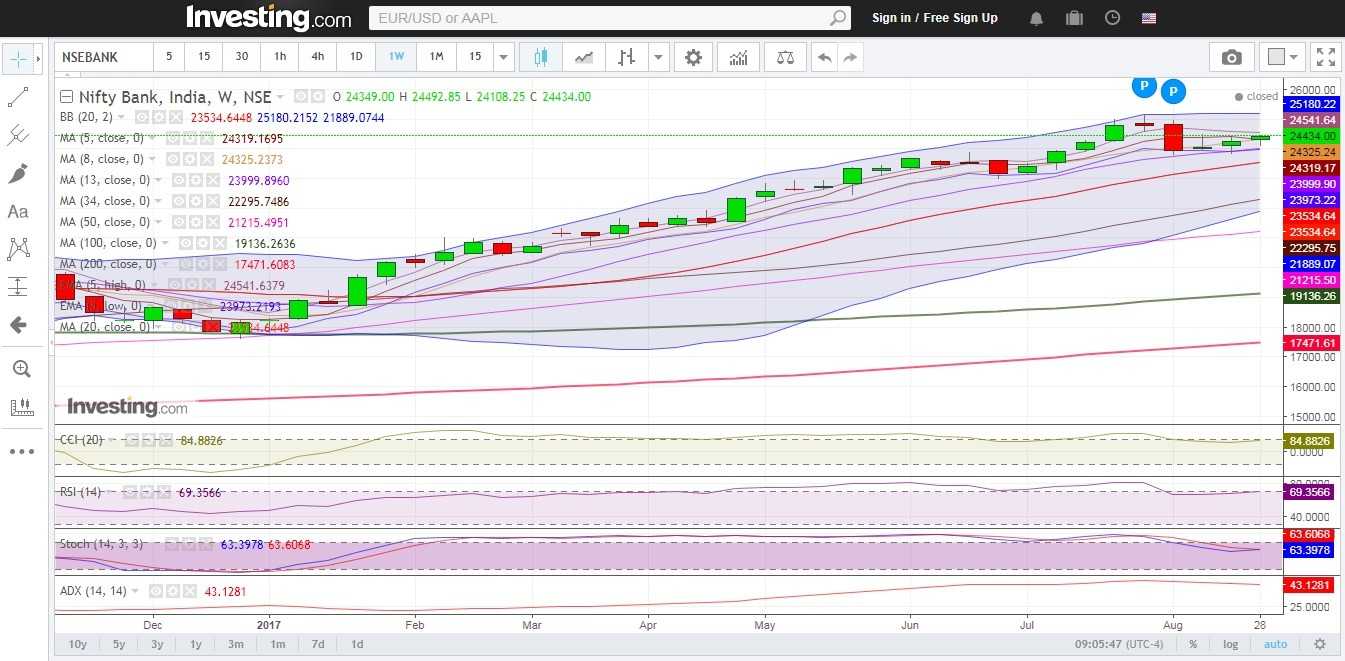
Figure: Weekly Chart
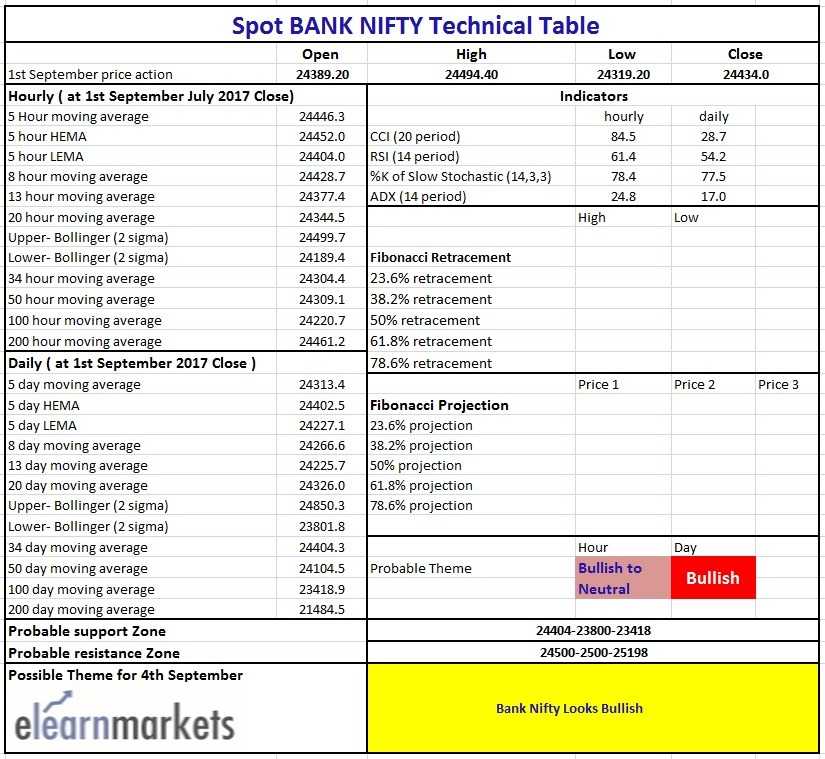
Figure: Tech Table
Watch the video below to interpret the above table:
