Nifty close 10333.3: Nifty witnessed a gap up opening of about 100 points on Friday’s session.
The Indian market cheered the exit poll outcomes for Gujarat and Himachal Pradesh Legislative Assemblies, which predicted a comfortable victory for BJP.
Hourly Technical:
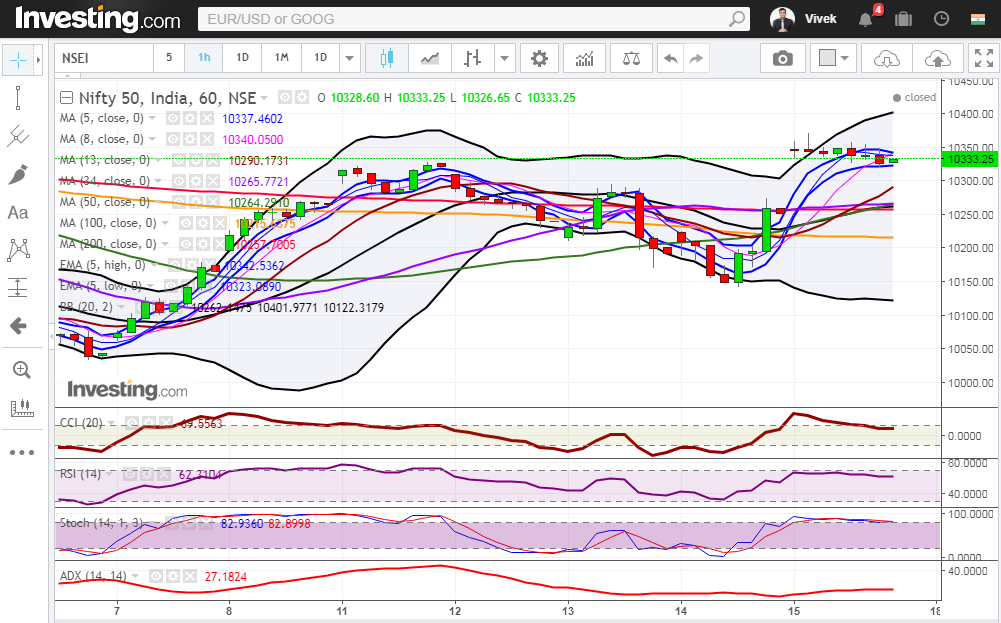
In the hourly chart, Nifty is trading above most short term moving averages.
The probable support in the hourly chart comes at 13 Hour moving average (presently at approx. 10290.2), 20 Hour moving average (presently at approx.10262.1) and 200 Hour moving average (presently at approx.10257.7).
On the upside, Nifty may face resistance at Upper Bollinger line (presently at approx.10401.2).
Hourly Stochastic is in the overbought zone while RSI and CCI are very close to the upper bound.
Moreover, the ADX is upward sloping indicating strong momentum in the hourly chart.
Overall, Nifty remained bullish to neutral in the Hourly chart.

Figure: Nifty Hourly Chart
Daily Technical:
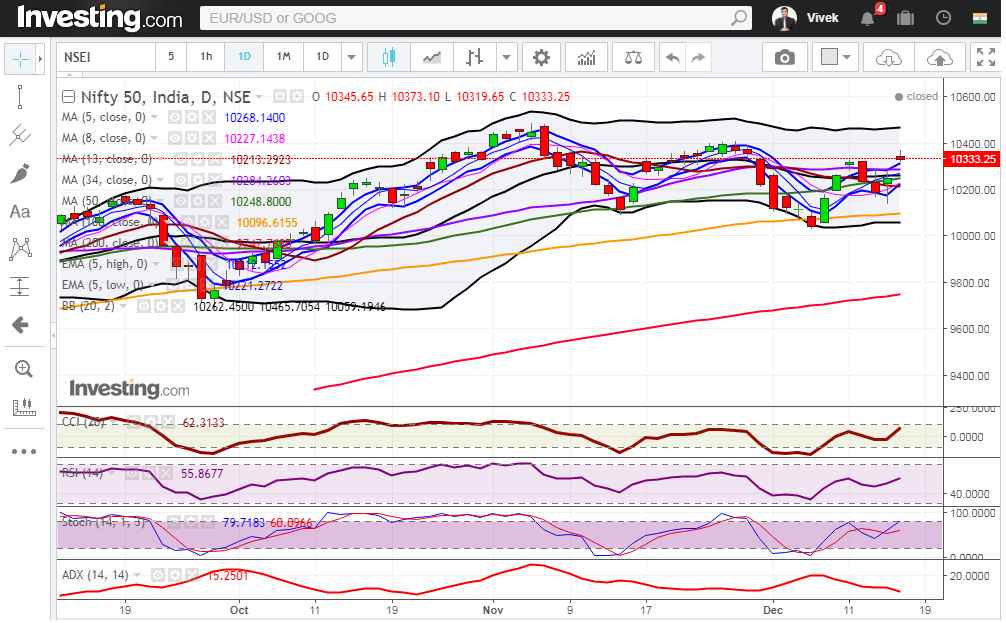
In the daily chart, Nifty crosses 5 Day High EMA and other short term moving averages which are very positive trigger in daily timeframe.
The probable support in the daily chart comes at 5 Day High EMA (presently at approx.10311.9), 34 DMA (presently at approx. 10284.2) and 20 DMA (presently at approx.10262.4).
On the upside, Nifty may face resistance at Upper Bollinger line (presently at approx. 10465.7).
Stochastic, RSI and CCI are in the normal zone but very close to the upper bound. Overall Nifty remains bullish to neutral in the daily chart.

Figure: Nifty Daily Chart
Weekly Technical:
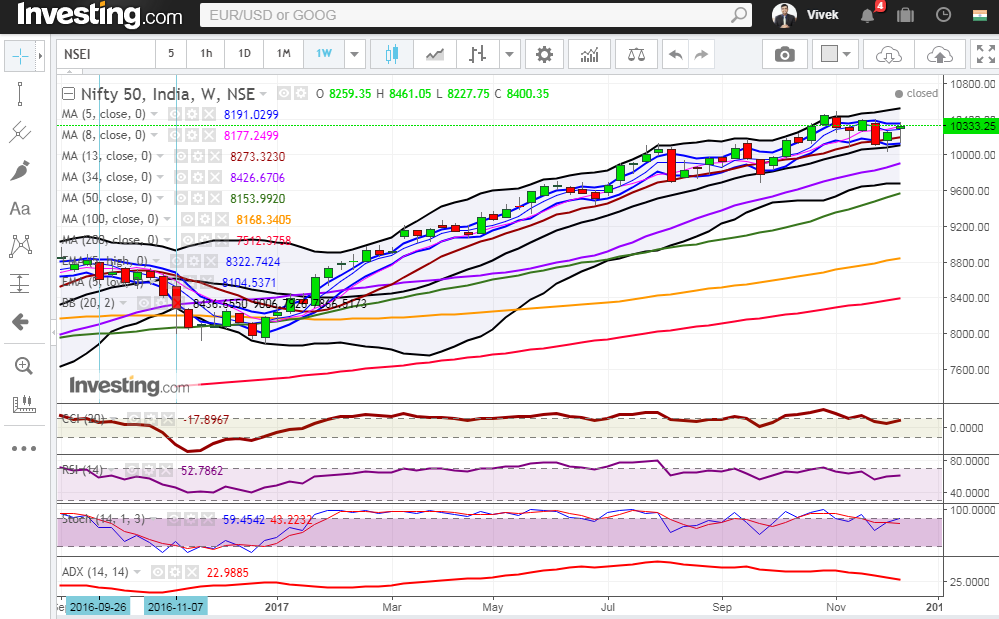
In the weekly chart, Nifty is still in the 5 Day High-Low band but very close to the upper bound.
The election result on Monday could trigger a fresh breakout in Nifty and could take Nifty to newer highs in the coming days.
Weekly Stochastic, RSI, and CCI are in the normal zone but very close to the upper bound suggesting bullish to neutral view in the weekly timeframe.

Figure: Nifty Weekly Chart

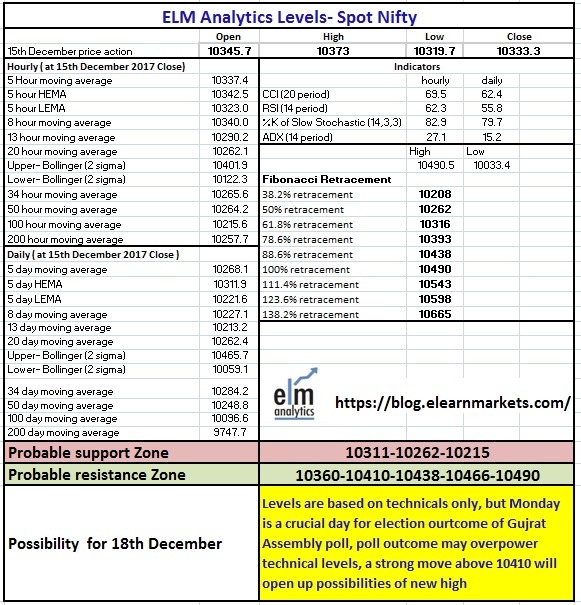
Figure: Nifty Tech Table
Watch the video below to know how to analyze the above tech table:


