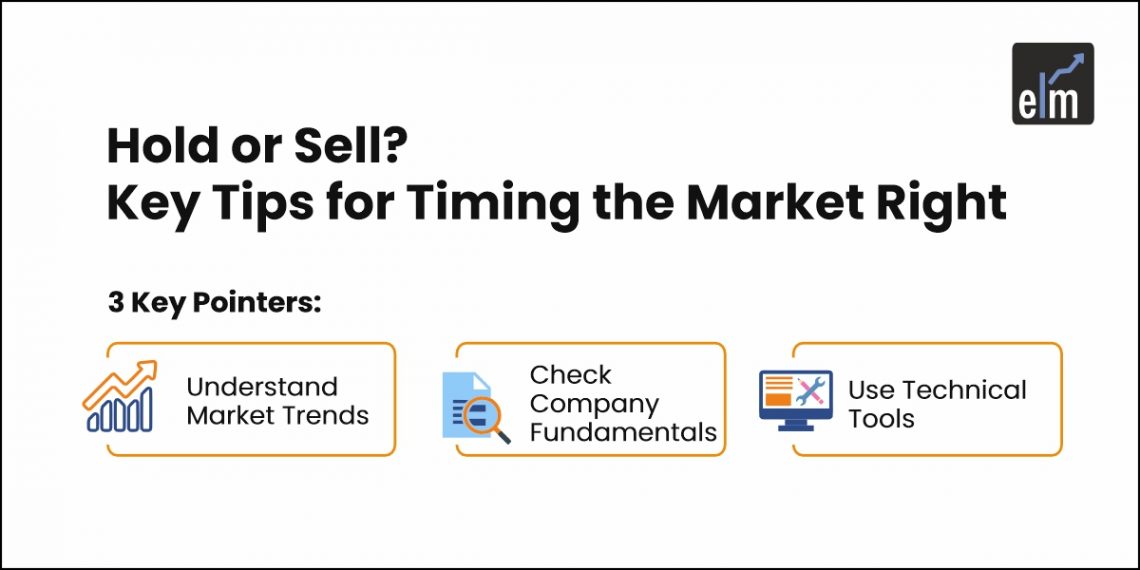
Many investors find themselves making poor decisions in the stock market simply because they aren’t familiar with market timing. Often, they watch their investments drop in value after buying, only to see prices surge once they’ve sold.
If you’re caught in this cycle, it might be because you haven’t yet mastered when to hold and when to sell. This guide is here to help you time your investments better, so you can boost profits and cut down on risks.
Understanding the Basics of Holding vs. Selling Investments
The final decision to hold or sell an investment can vary for every investor based on their investment strategy, risk appetite, and financial goals.
A move that might seem like a loss for a short-term investor could actually turn into a profit for someone willing to hold on for a few more years.
Key Factors Influencing Investment Decisions
Even though there is no one-size-fits-all strategy for investing, there are certain factors that affect every investment. Here are a few things to keep in mind when deciding when to hold and when to sell your securities.
Market Trends:
There are primarily two market trends: bull and bear. When prices are rising, the market is bullish and it encourages more investments. A bearish market, on the other hand, is just the opposite and pushes more investors to sell their investments.
Inflation, demand and supply of a security, interest rates, market conditions, and international trade are some factors that affect these trends.
Company Performance:
A company’s performance directly affects its securities. Growth potential, cash flows, profits, key management, industry, and its products and services are a few factors that shed light on its performance and potential.
Economic Indicators:
A country’s economy and stock market go hand in hand. A booming economy leads to bullish markets and more investments, whereas a falling economy forces investors to sell their holdings and liquidate cash.
When to Hold: Signs of Growth and Stability
Every mindful investor looks for certain positive signs to invest or continue holding on to their investments. Here are some methods that you can use to identify the return potential of your investments while deciding when to hold and when to sell your securities:
Evaluating Long-Term Investment Potential
Just because a stock is doing well at present doesn’t mean it will give the same results in the future. You can determine when to hold or when to sell a security in the long run by analysing the growth in its earnings and market dominance in the coming years.
Consistent Earnings Growth:
A company’s earnings are a reflection of the demand for its products and services. A rising graph of its consistent earnings shows its organic growth potential, thus making it a less risky investment.
For example, TCS is not only one of the leading IT sector companies but also has one of the largest market caps of 14.91 trillion. The company has consistently shown a steady increase with a 10.46% 5-year capital annual growth rate in sales. This growth highlights the demand for TCS’s services and also its future return potential.
Market Dominance and Competitive Edge:
A company with a higher level of market dominance is more resilient to disruptions and poor economic conditions. This means that it may continue to provide better returns as compared to its competitors in adverse market conditions, thus making it a more suitable choice in the long run.
Fundamental Analysis for Holding
Fundamental analysis is a framework to determine if a company’s stock is overvalued or undervalued. Here are two key formulas that can help you determine a share’s growth potential in the long term for effective portfolio management.
Price-to-Earnings Ratio:
One of the most popular metrics to determine the growth potential of a stock is its price-to-earning or P/E ratio. It is the relationship between the stock price of a company and its earnings per share. A lower PE ratio indicates undervalued stocks and vice versa. You can calculate the PE ratio by using the following formula:
PE Ratio = Price per share/Earnings per share
Dividend Stability:
A company’s long-run growth can also be determined to a certain extent by looking at its records for dividend stability. Consistency in declaring dividends shows a stable profit record irrespective of any market volatility.
When to Sell: Recognising Warning Signs
For better portfolio management, knowing the right time to sell off your investment is as important as knowing the best time to buy it. These are some warning signs that you should watch out for to minimise your risks while deciding when to hold and when to sell your securities:
Overvaluation and Market Bubbles
When stock prices exceed their intrinsic value, they are said to be overvalued. However, when the stock prices start rising beyond any reasonable explanation, it is called a market bubble.
Identifying Inflated Stock Prices:
There are various metrics to identify inflated stock prices and market bubbles. The first is the PE Ratio, which we have already discussed. You can also use Return on Equity or ROE, which is calculated by dividing the net income of the company by shareholder’s equity. If the company has a low ROE, it means that it’s not generating enough profits on its investments.
You can also try sector analysis to see if people are investing in a stock just out of speculation or popularity, which is, again, another red flag to identify an overvalued stock.
Risk of Market Correction
Price fluctuations in the market are a way of correcting and reversing trends. If a stock price has inflated, it will also be corrected. While small fluctuations are quite normal, bubble bursts directly lead to a price crash that can cause significant financial loss to investors.
Since it is hard to tell when the correction may take place, it is best to avoid stocks with inflated prices, especially if you do not want to lose your capital.
Declining Fundamentals
Another method to decide when to hold and when to sell a stock is to check the company’s fundamentals. Here are the key fundamentals that reflect the company’s financial health:
Shrinking Revenues and Profitability:
There could be numerous reasons for a company’s decline in profits and revenues in specific periods. However, if you see a consistent pattern or a downward graph year-on-year, then it may be a warning sign to sell your investments in the company.
Increasing Debt Ratios:
While most companies have a certain ratio of debt to equity, it may become a concern if the debt continues to rise. It is a sign of high financial dependence and lack of funds. A higher debt ratio could also lead to insolvency risks, which would lead to a loss in your investments as well.
Timing the Market: Tips and Strategies
Now that you understand some indicators to decide when to hold and when to sell your investments, here are some additional tips to guide you in efficient portfolio management.
Technical Analysis Tools
Technical analysis tools help you make informed decisions and create a mindful investment strategy by analysing the past performance of a stock.
Moving Averages:
A moving average is a technical analysis tool derived by dividing the price of a stock price over a specified period with different data points. The purpose of a moving average is to mitigate the effects of smaller fluctuations and analyse the overall price trend of a stock.
You can also plot more than one moving average on a chart and observe how they cross over with each other; it is called a moving average crossover. A crossover indicates a change in the trend, thus signalling an entry or exit point depending on your strategy.
Relative Strength Index:
This is another tool that helps you determine if a stock is overbought or undersold, assisting you in formulating a relevant investment strategy. The index calculates the speed and the rate at which the price of a stock is changing in the market.
It is usually calculated for 14 days and the indicator ranges from 0-100. Any value under 30 indicates undervalued security and any value above 70 is a signal of overvalued stock.
Dollar-Cost Averaging vs. Lump Sum Selling
Dollar-cost averaging is the method of selling your investments in smaller parts to avoid the risk of selling at lower prices. Lump sum, on the other hand, means selling your entire investment in one go, allowing you access to a larger sum of cash immediately.
Conclusion
To be able to decide when to buy and when to sell a stock, it is vital to frame a good investment strategy that aligns with your risk appetite to meet your financial goals. It also requires periodic revisions to make sure it is aligned with the market trends and offers you the maximum returns.
While we have covered the basics, you can gain a more thorough knowledge of market timing by enrolling in Elearnmarket’s Masterclass on Price Action Trading Strategies. This will help you to strengthen your analysis and prediction skills, helping you to make more confident investment decisions.
Read Also: What is Positional Trading? Strategies and Benefits for Traders helps you understanding better When to hold and when to sell in the market.
Timing is everything, so optimize your trades with understanding When to hold and when to sell in the market!


