Nifty close 10399.6: Benchmark indices started the week on a weaker note but recovered in the second half to close at 10400 mark.
Hourly Technical:
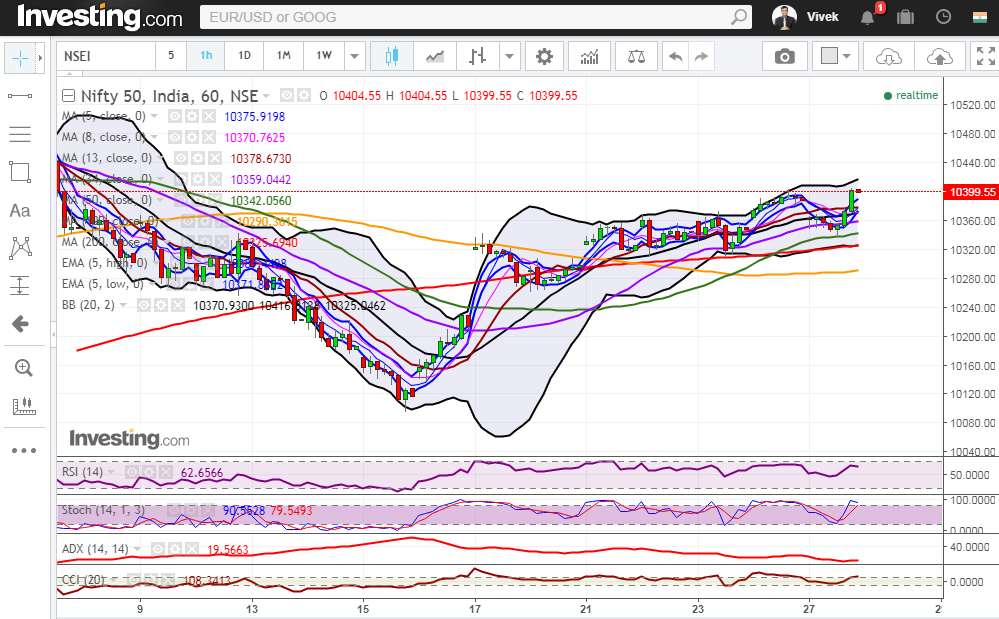
In the hourly chart, Nifty bounced from 50 Hour moving average (presently at approx. 10342.1) and gave about 60 points rally in the second half of today’s trading session.
The probable support in the hourly chart comes at 8 Hour moving average (presently at approx.10370.8), 34 Hour moving average (presently at approx.10359) and 50 Hour moving average (presently at approx.10342.1).
On the upside, Nifty may face resistance at Upper Bollinger line (presently at approx.10416.8).
Hourly Stochastic and CCI are in the overbought zone while RSI is very close to the upper bound. Moreover ADX has again turned up. Overall Nifty remained bullish in Hourly time frame.
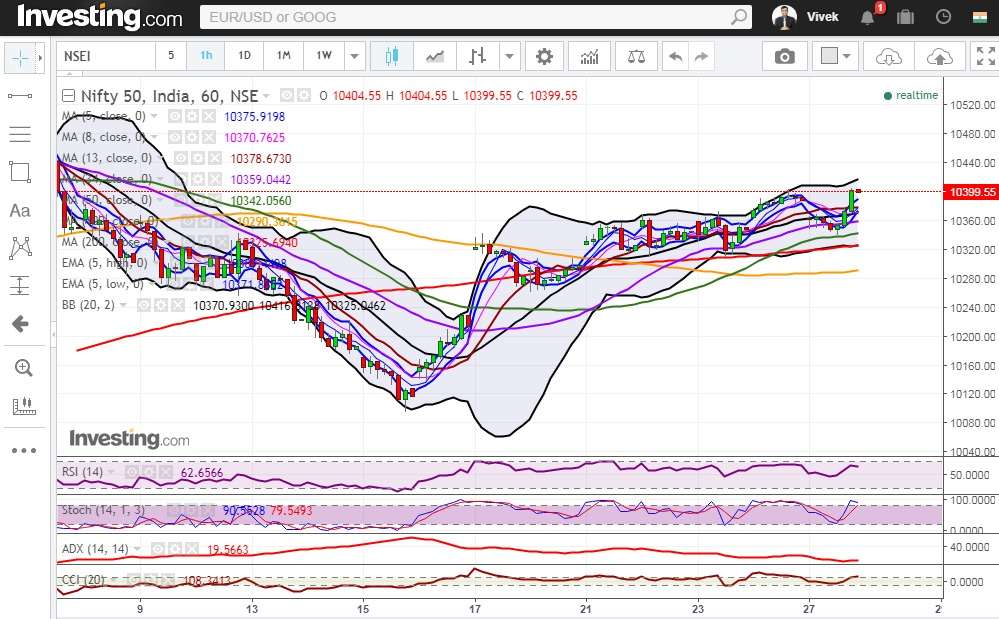
Figure: Nifty Hourly Chart
Daily Technical:
In the daily chart, Nifty has again closed above 5 Day High EMA and also above most short term moving averages. The probable support in the daily chart comes at 5 Day High EMA (presently at approx.10379.7) and 20 DMA (presently at approx.10326.1).
On the upside, Nifty may face resistance at Upper Bollinger line (presently at approx.10501.6).
Daily Stochastic has entered the overbought zone while RSI and CCI are still in the normal zone but inching towards the overbought area. Overall, Nifty remained bullish to neutral in the daily time frame.
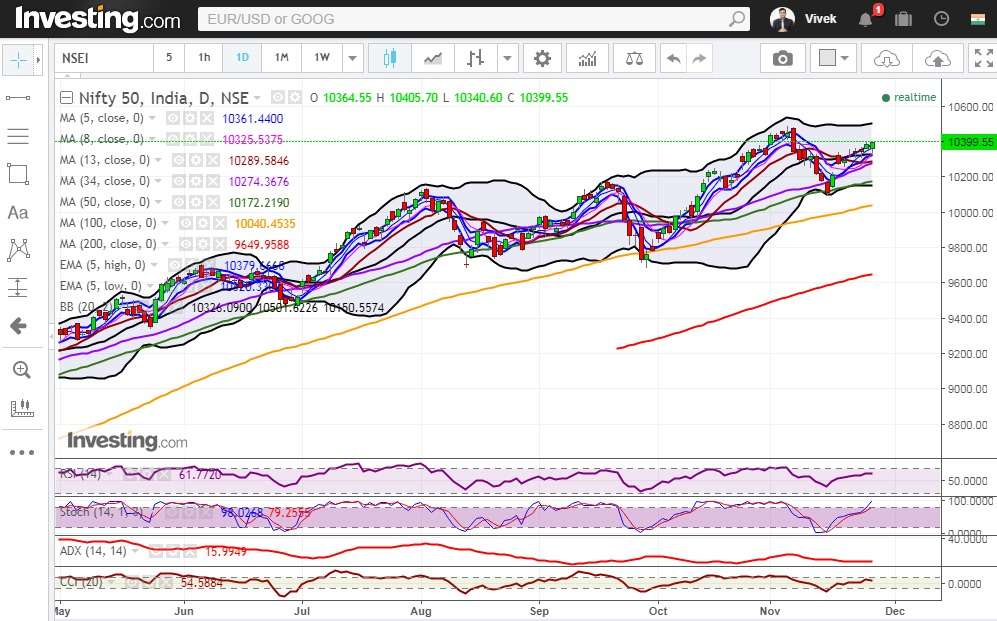
Figure: Daily Chart

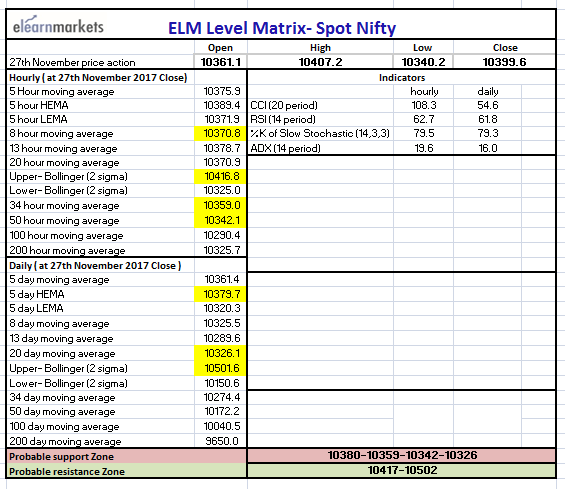
Figure: Tech Table

BOTTOMLINE
Visit blog.elearnmarkets.com to read more blogs.
Get data and also create your own combination scans based on your own technical and fundamental parameters on Stockedge.


