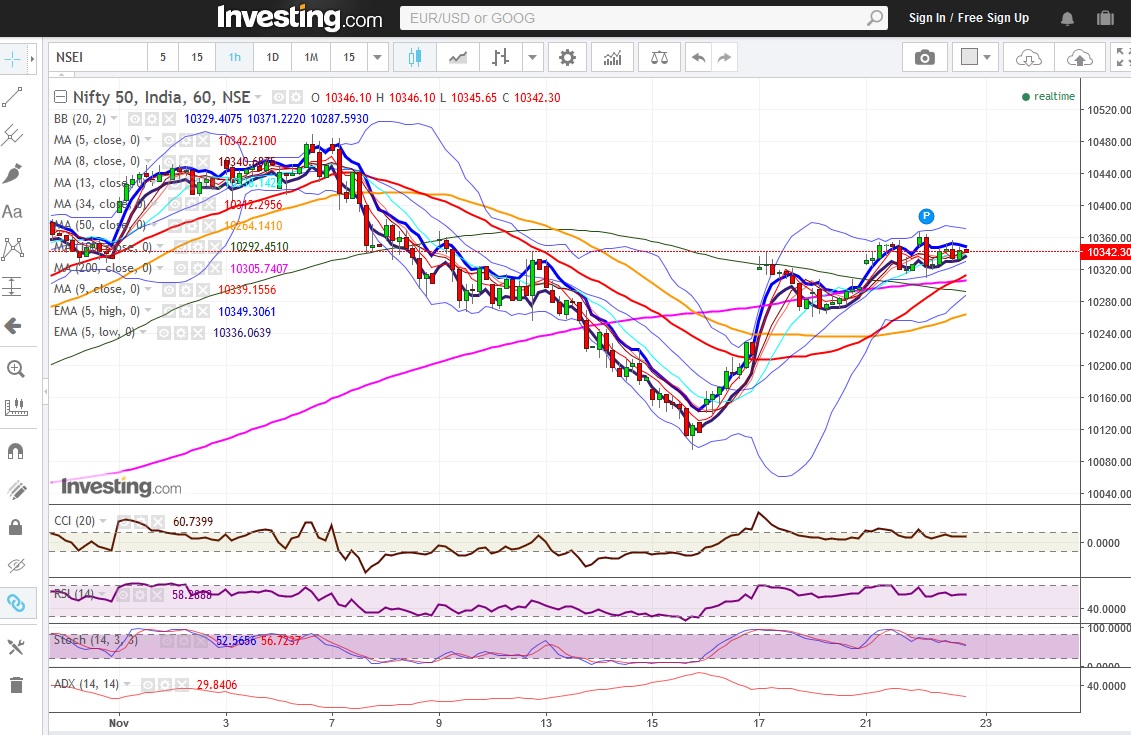
Nifty (Close 10342.30): Nifty opened quarter of a percent gap up today based on bullish global cues, however sold off from today’s highs and eventually closed the day with minor gains.
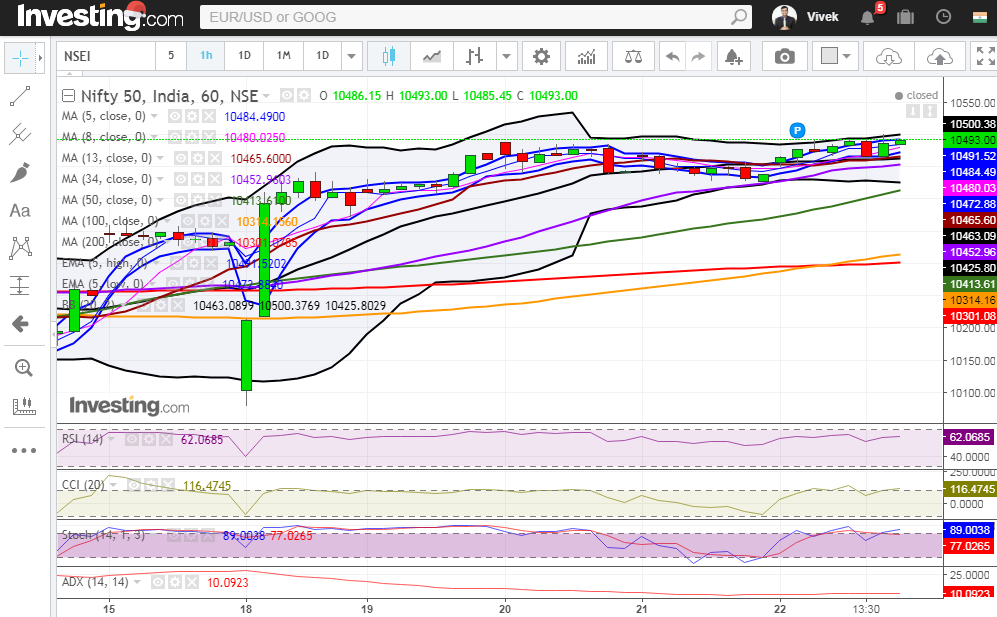
Hourly Technicals: In hourly chart, nifty is very range-bound. The Index is attempting to scale higher levels, but there is definite selling pressure at the upper end of this short range, while at the bottom of the range there is buying support.
On the down side Nifty may find support near 20 hour sma, 34 hour sma, 50 hour sma, 100 hour sma and 200 hour sma which are presently at approx. 10329, 10312, 10264, 10292 and 10306 respectively. As we can see that all the hourly moving averages are clustered within, 10265-10329 zone, hence if there is break of this zone, market may choose to correct further.
On the upside, upper Bollinger live (presently at approx 10371) may act as a resistance.
The Fibonacci retracement levels of the fall from approx. 10490.5 to 10095.4 (78.6% at approx. 10406, 88.6% retracement at approx. 10445) may act as resistances if the market moves higher.
The hourly CCI, RSI and Slow stochastic are within normal range and are showing mildly bullish indications. The hourly ADX is lacking upside or downside momentum.
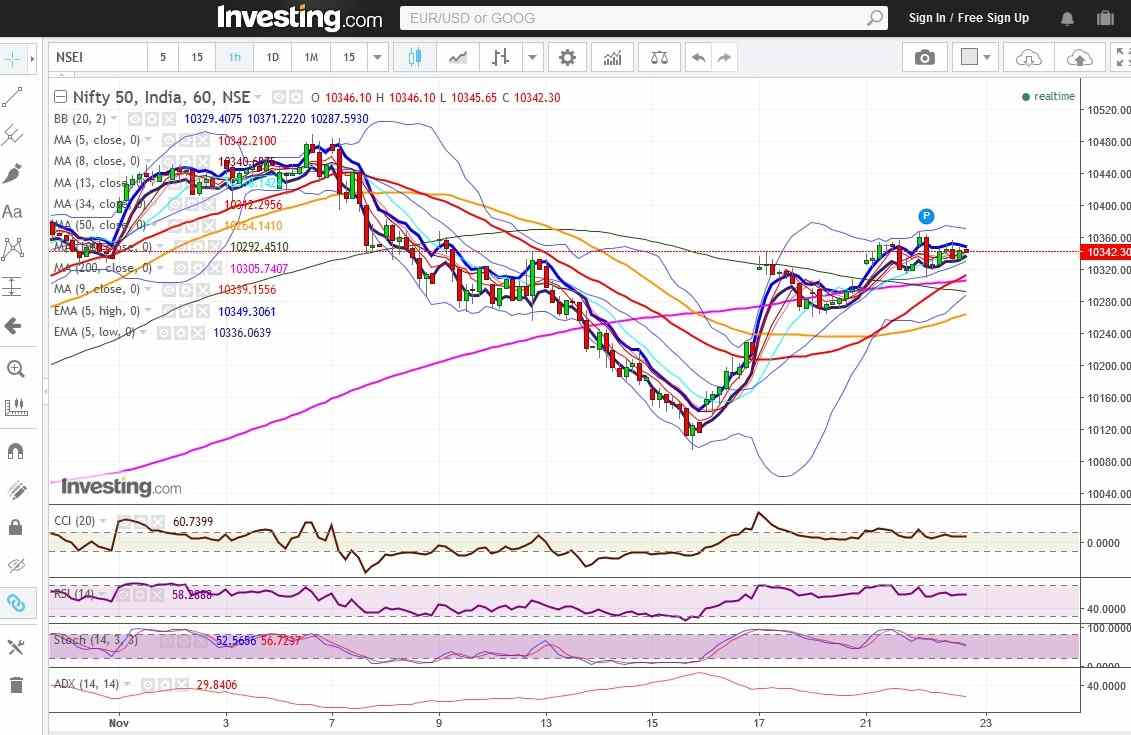
Figure: Nifty Hourly Chart
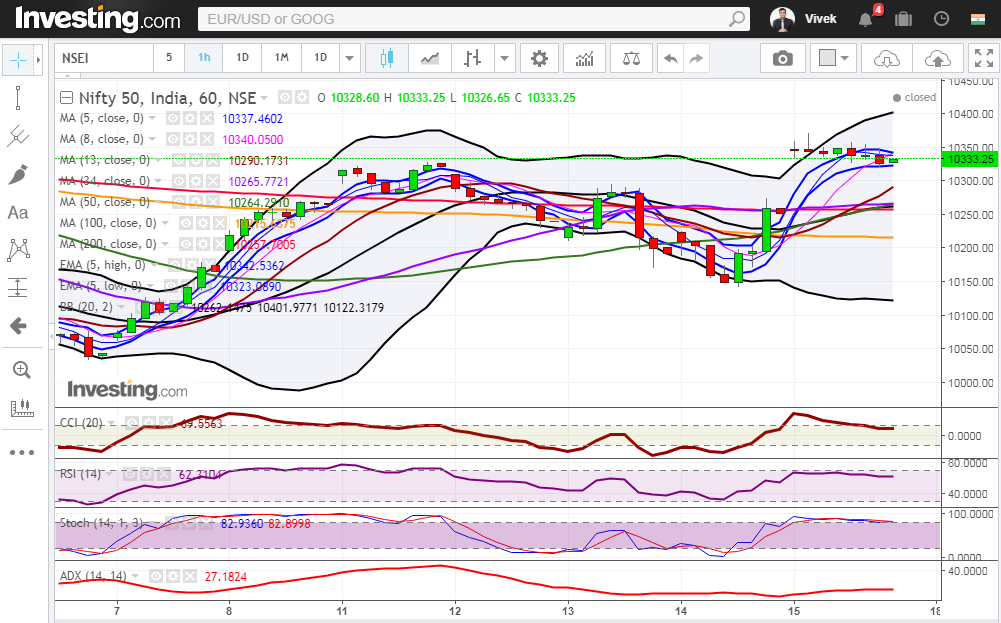
Daily Technicals: In daily chart, Nifty is mildly bullish, as it is 2nd consecutive close above 20 DMA. However, the formation of two consecutive Dojis put a question mark on bullishness.
On the downside, 20 day simple moving average (presently at approx. 10321) may act as first support. Below that, more significant support may come at 13 day SMA (presently at approx. 10287), 8 day SMA (presently at approx 10249) and 34 day SMA (presently at approx. 10237).
The daily CCI, RSI and Stochastic are above midpoint of their respective normal zones and are showing mild bullish to neutral sentiment. The daily ADX is indicative of complete lack of momentum in last three trading sessions.
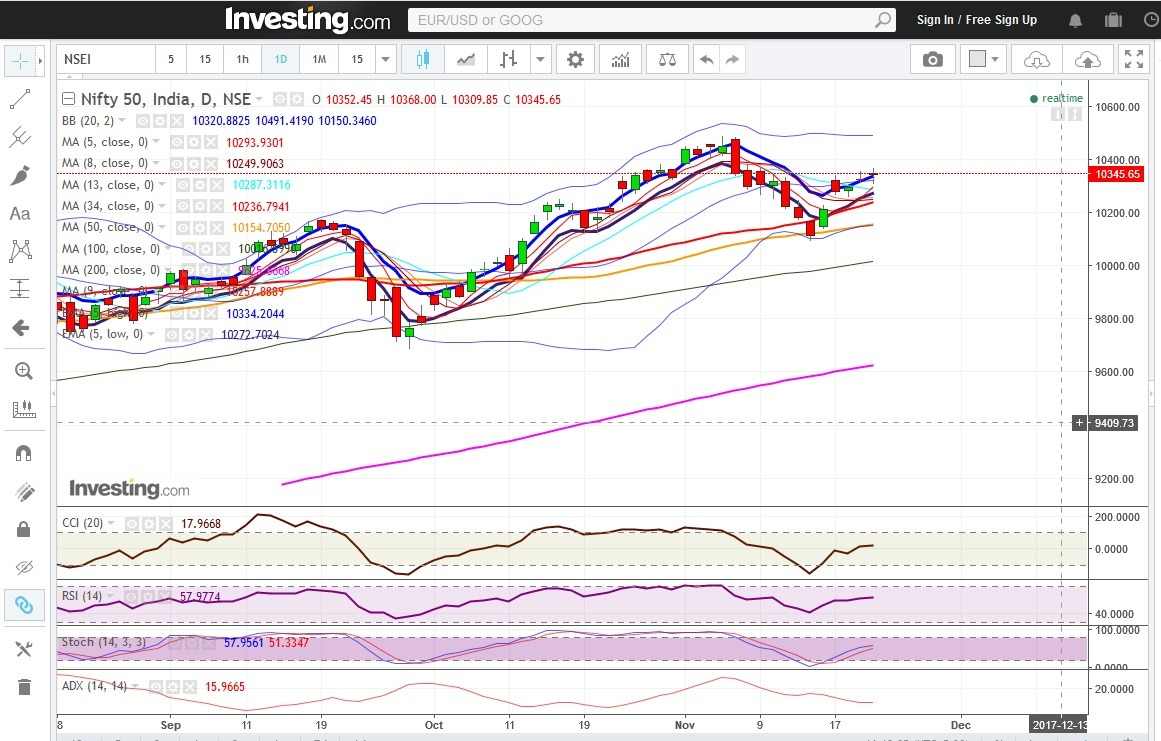
Figure: Nifty Daily Chart
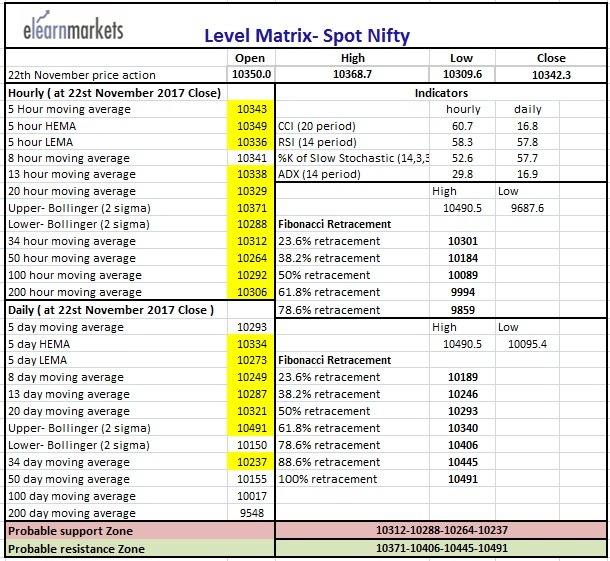
Figure: Nifty Tech Table
