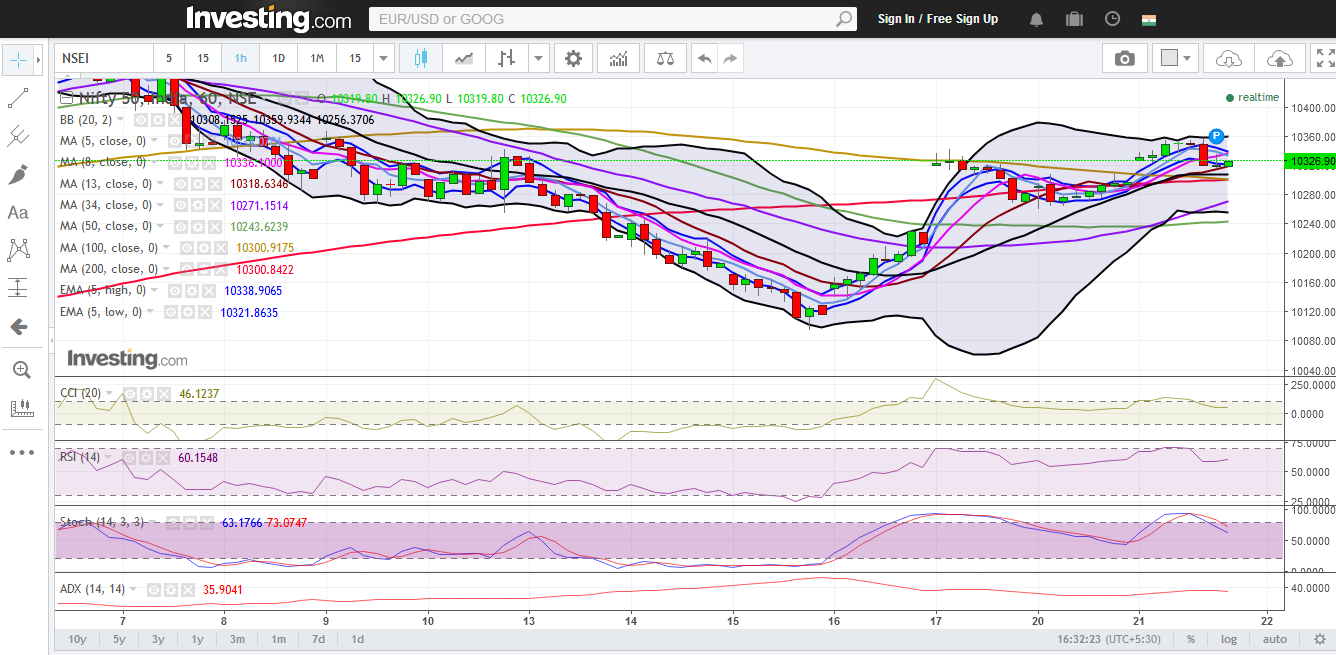
Nifty (Close 10326.9): It opened with a slight gap up and closed around its opening level, above 20 Daily Moving Average.
Hourly Technicals: In the hourly chart, Nifty consistently experienced buying pressure in the first half and was on the rise, staying above its 5 Hour High EMA. The second half saw some correction in prices but closed with a mild gain for the day. The probable support levels are the Lower Bollinger Line (presently at approx. 10256.4) and the 200 Hourly Moving Average ( presently at approx. 10300.8).
On the upside, it may face resistance at the Upper Bollinger Line (presently at approx. 10359.9).
Hourly CCI, RSI and Slow Stochastic are in the normal zone, close to their mid-point range, indicating directionless-ness. Due to second half sell-off, ADX saw a slight rise in momentum.
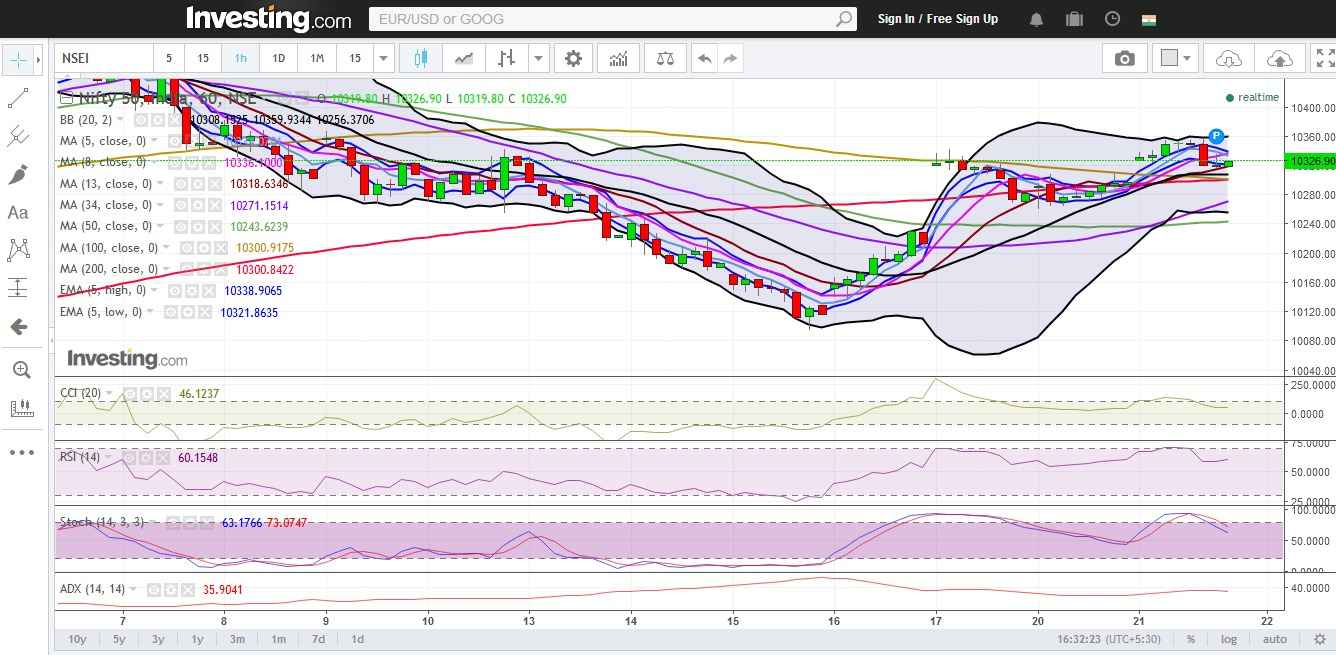
Figure: Nifty Hourly Chart
Daily Technicals:
In the daily chart, Nifty closed above almost all of its moving averages and closed slightly below its opening level. The probable support levels on the downside are the 5 Day Low EMA (presently at approx. 10254.2), 13 Day Moving Average (presently at approx. 10295.5), 34 Day Moving Average (presently at approx. 10224.1).
The probable resistance level for tomorrow is the Upper Bollinger Line (presently at approx. 10488.9).
Hourly CCI, RSI, slow stochastic are close to the mid-point of their normal range, indicating directionless-ness. The hourly ADX continues to show lack in momentum.
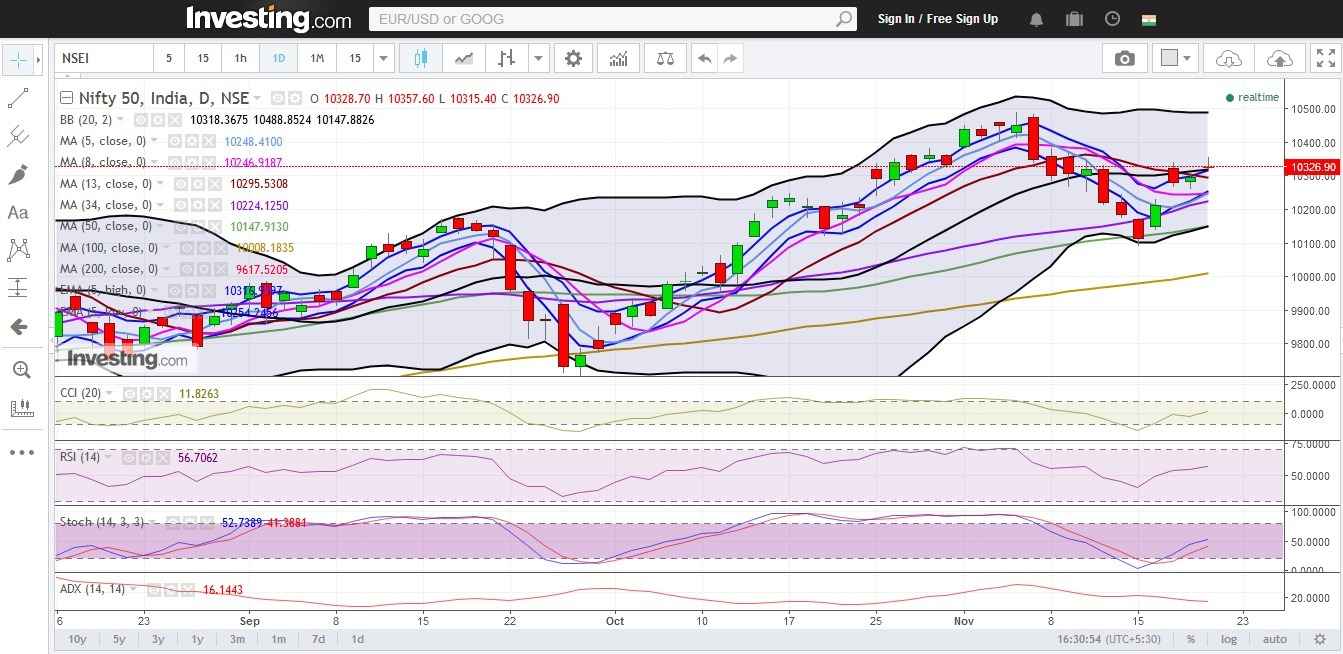
Figure: Bank Nifty Daily Chart
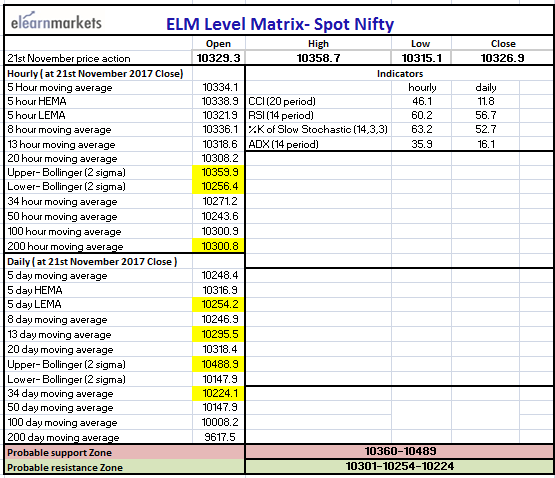
Figure: Bank Nifty Tech Table

BOTTOMLINE
Visit blog.elearnmarkets.com to read more relevant blogs.
Click here to visit Stockedge and get latest share market updates.
