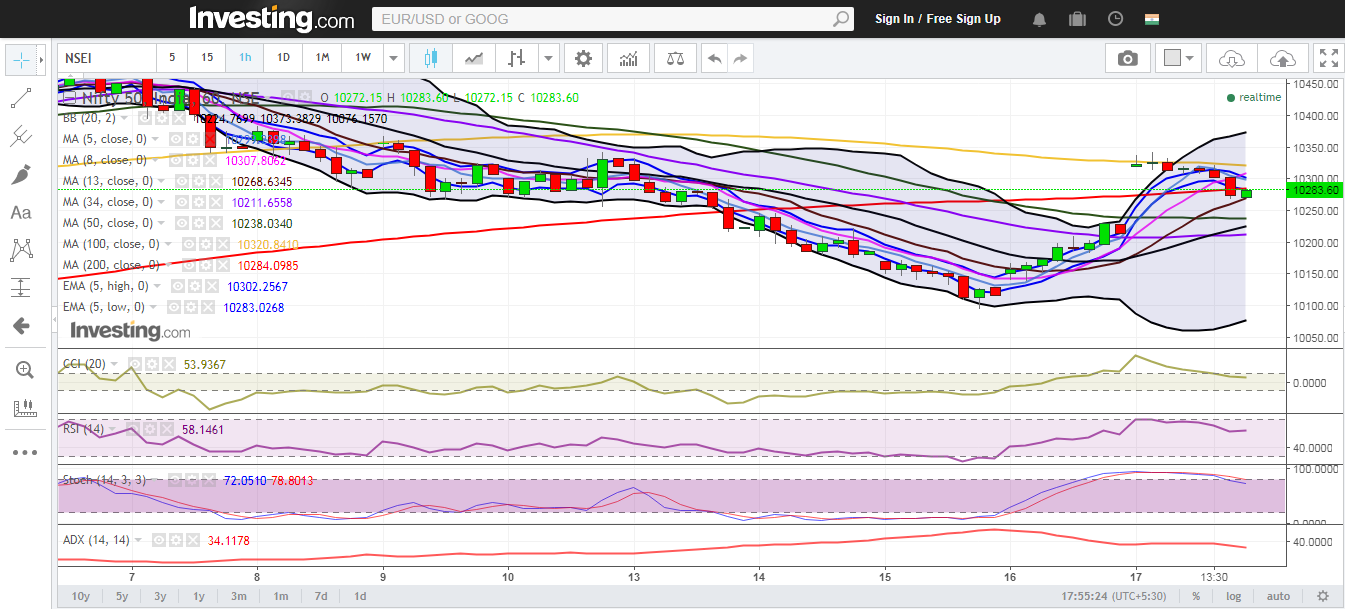
Nifty close 10283.6: For the first time in 14 years, Moody’s upgraded India’s sovereign debt rating from Baa3 to Baa2. The index opened 110 points above its previous close. However, the buying sentiment could not be maintained and the second half experienced above average selling pressure.
Hourly Technical:
In Hourly chart, Nifty was quick to succumb to the selling pressures after a doji was formed early in the first half. The probable support in the hourly chart stands at the 20 Hour Moving Average (presently at approx. 10224.8) and the 34 Hour Moving Average (presently at approx. 10211.7). The 50 Hour Moving Average (presently at approx. 10238.0) forms the third support area for the benchmark index.
On the upside, Nifty may face resistance at its 100 Hour Moving Average (presently at approx. 10320.8) and Upper Bollinger Line (presently at approx. 10373.4).
The CCI, RSI and Stochastic are in the normal zone. A continuation from yesterday, ADX remains down suggesting loss in downside momentum. Overall Nifty remains neutral to bearish in the hourly chart.
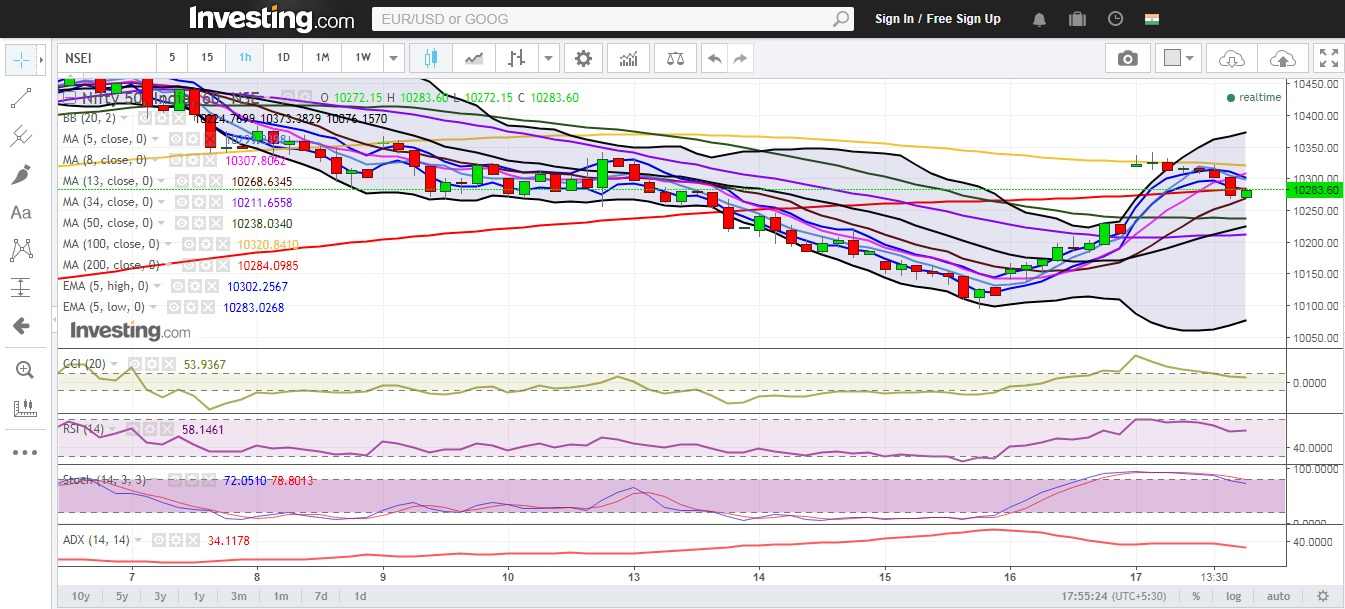
Figure: Nifty Hourly Chart
Daily Technical:Nifty Hourly Chart
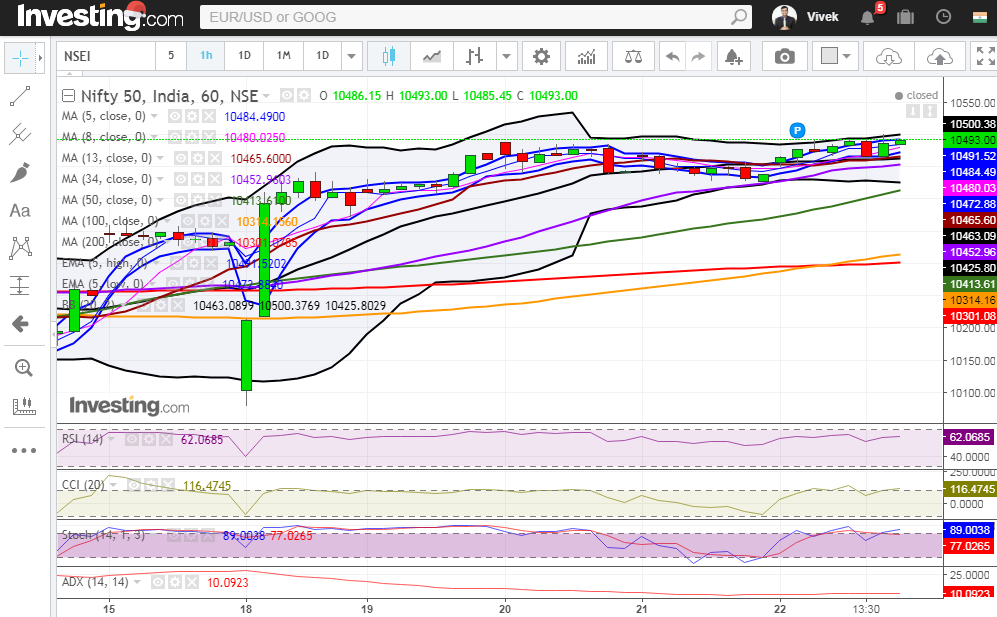
In the daily chart, Nifty closed just below its 5 Day High EMA even though it stayed above this level for the major part of today’s session. The 5 Day High EMA had been a constant resistance level for the index in the past few days. The probable support in the Daily chart comes at the 5 Day Low EMA (presently at approx. 10205.1), the 8 Day Moving Average (presently at approx. 10245.2) and at the 34 Day Moving Average (presently at approx. 10195.4).
On the upside, Nifty may face resistance at its 20 Day Moving Average (presently at approx. 10306.7).
The CCI, RSI and Stochastic are in the normal zone. Overall Nifty remains neutral to bearish in the daily chart.
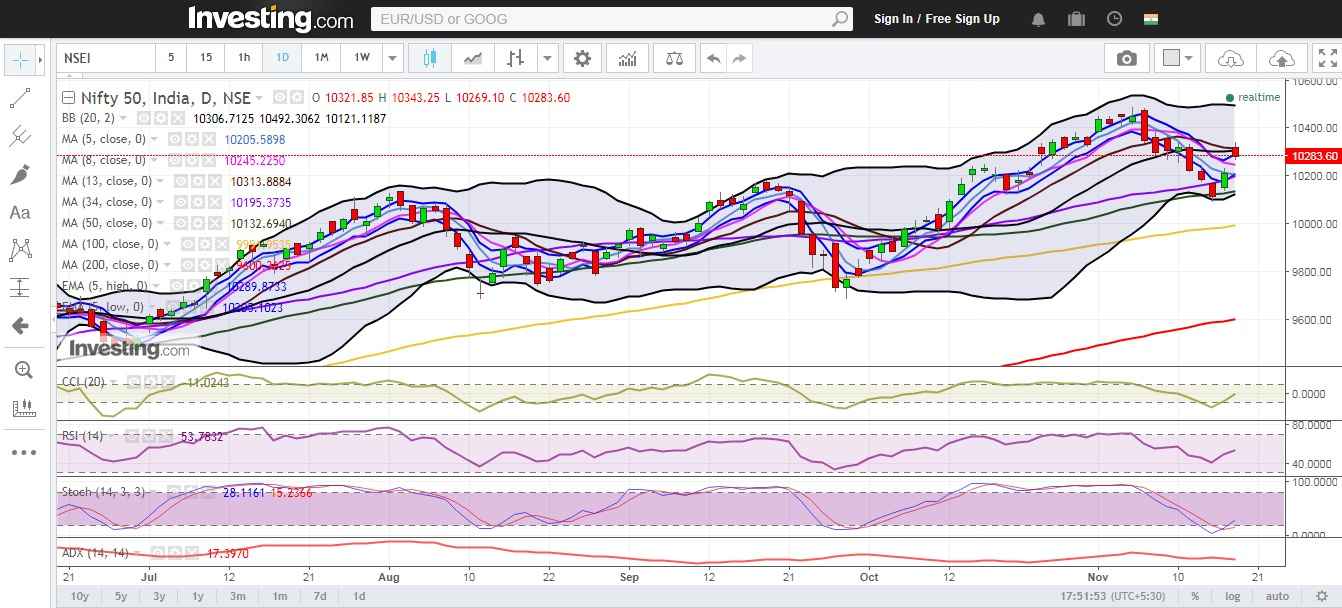
Figure: Nifty Daily Chart
Weekly Technical:
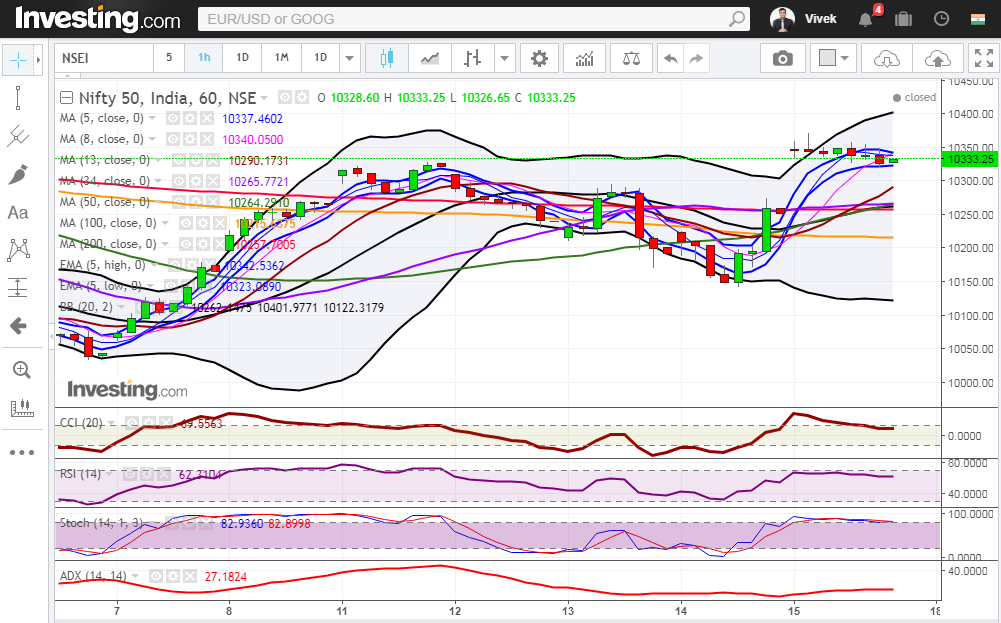
In the weekly chart, Nifty closed at 10283.6 , which is, marginally below its 5 Weekly Moving Average (presently at aprrox. 10305.5). In the whole week, Nifty moved by almost by 250 points between 10343.3 and 10095.4. The probable support in the Weekly chart comes at the 8 Day Low EMA (presently at approx. 10182.9) and the 13 Day Moving Average (presently at approx. 10098.4).
On the upside, Nifty may face resistance at its 5 Weekly High EMA (presently at approx. 10355.0) and Upper Bollinger Line (presently at approx. 10433.8).
The Stochastic is in the overbought zone while CCI and RSI has remain subdued. ADX movement does not suggest any major volatility in the weekly time frame.
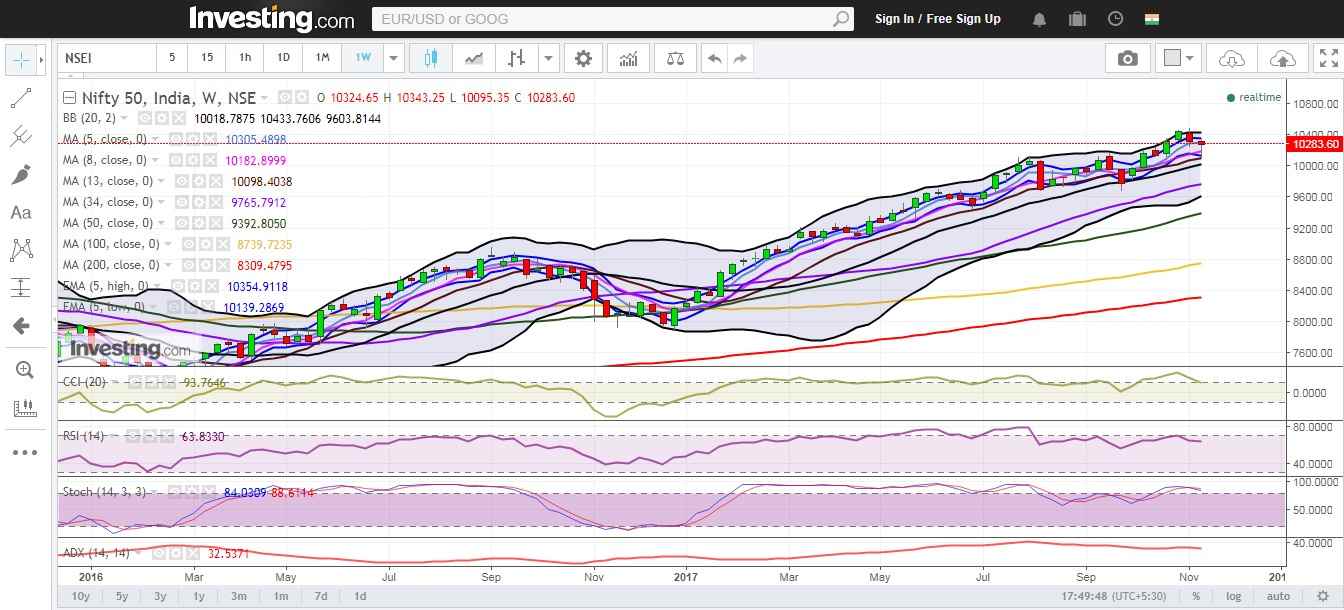
Figure: Nifty Weekly Chart
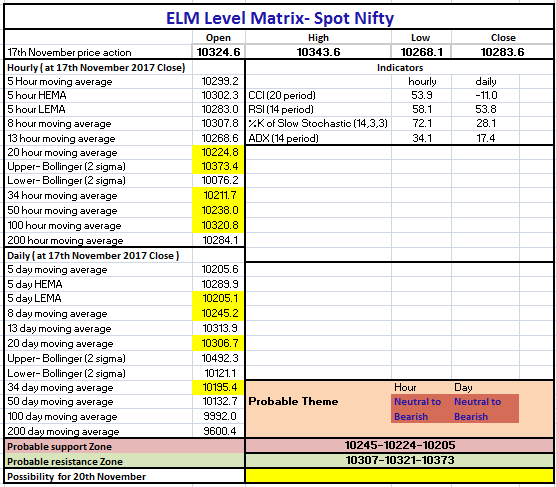
Figure: Nifty Tech Table
