Nifty close 10350.2: Nifty opened near the life time high area and saw heavy selloff in today’s session. The main drag came from Lupin which fell more than 16% after receiving warning letters from USFDA.
Hourly Technical:
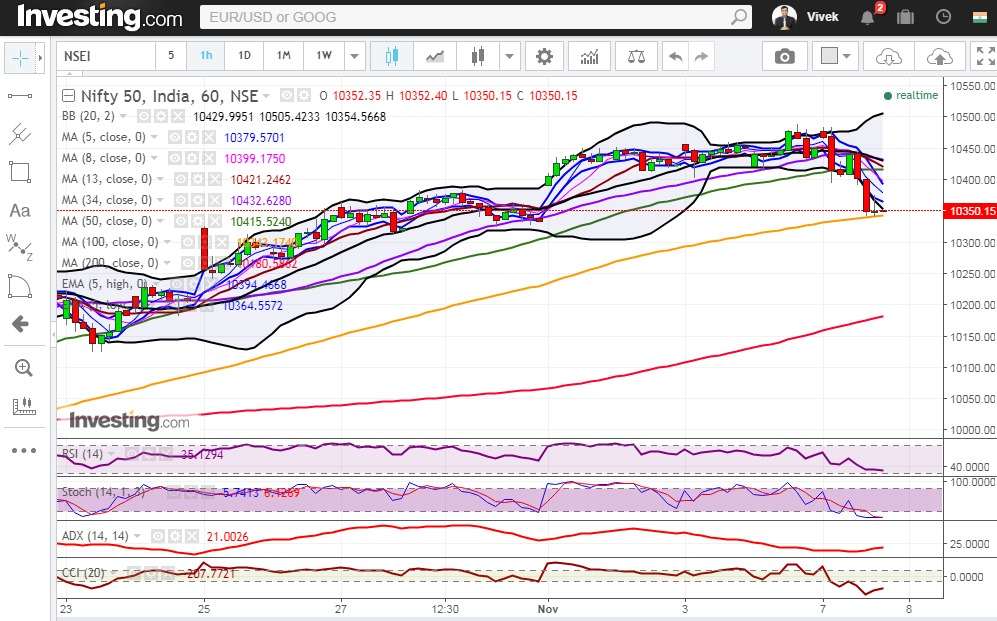
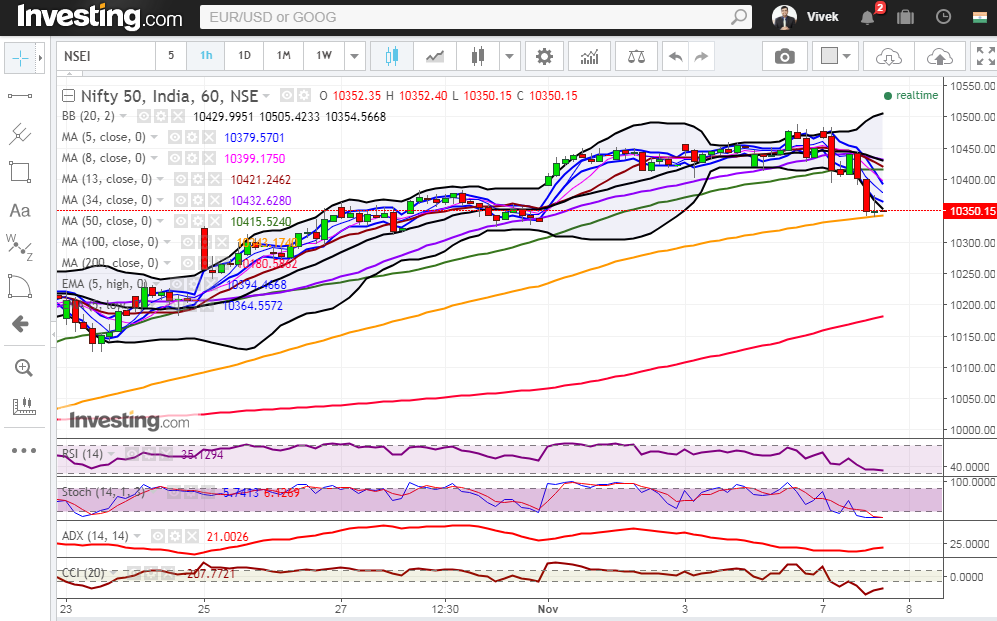
In the hourly chart, bears took over the bulls and the selloff continued throughout the day and closed right at the 100 Hour moving average (presently at approx. 10343.2). The probable support in the hourly chart comes at 100 Hour moving average (presently at approx. 10343.2).
On the upside, Nifty may face resistance at 8 Hour moving average (presently at approx.10399.2) and 20 Hour moving average (presently at approx. 10430).
Hourly CCI and RSI are in the oversold zone while RSI is very close to the lower bound. Moreover, the ADX has once again turned up suggesting gain in downside momentum. Overall, Nifty remained bearish to neutral in the Hourly chart.

Figure: Bank Nifty Hourly Chart
Daily Technical:
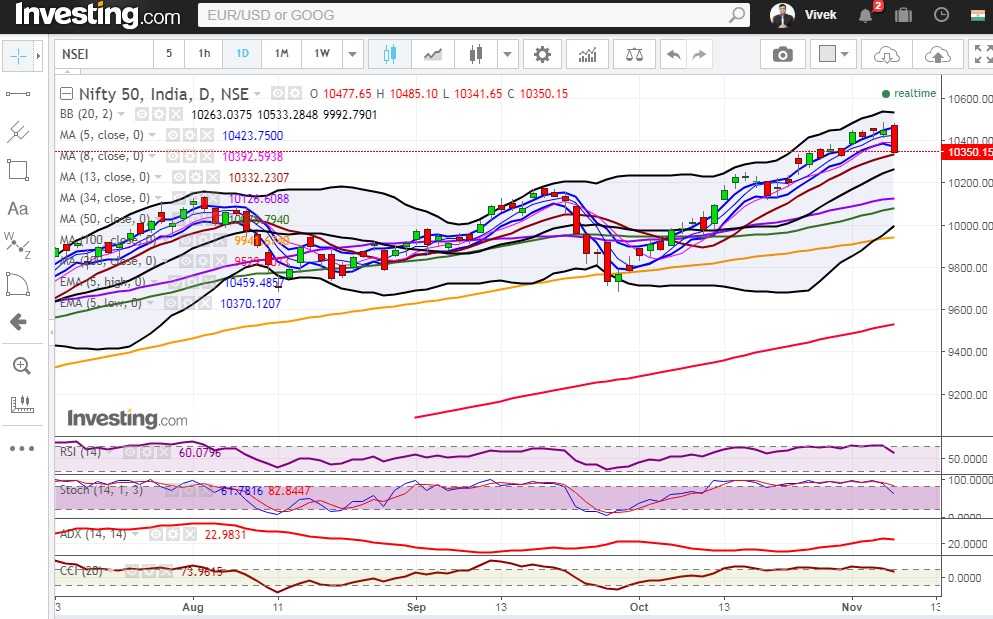
In the daily chart, Nifty has closed below 5 Day Low EMA (presently at approx.10370.1) after almost 1.5 months and there is very strong bearish engulfing pattern at the top, so it’s time to be little cautious. The probable support in the daily chart comes at 13 DMA (presently at approx.10332.2) and 20 DMA (presently at approx. 10263).
On the upside, Nifty may face resistance at 5 Day Low EMA (presently at approx.10370.1), 8 DMA (presently at approx. 10392.6) and 5 Day High EMA (presently at approx.10459.5).
Stochastic, CCI and RSI have entered the normal zone from the overbought zone while ADX has also turned down suggesting loss of upside momentum. Overall Nifty remains neutral in the daily chart.

Figure: Bank Nifty Daily Chart
Figure: Bank Nifty Tech Table


