Bank Nifty opened above its 5 Day High EMA (25531 approx). The Index traded in a range of 301 points and closed above its opening price of (25651 approx).
Hourly Technicals:
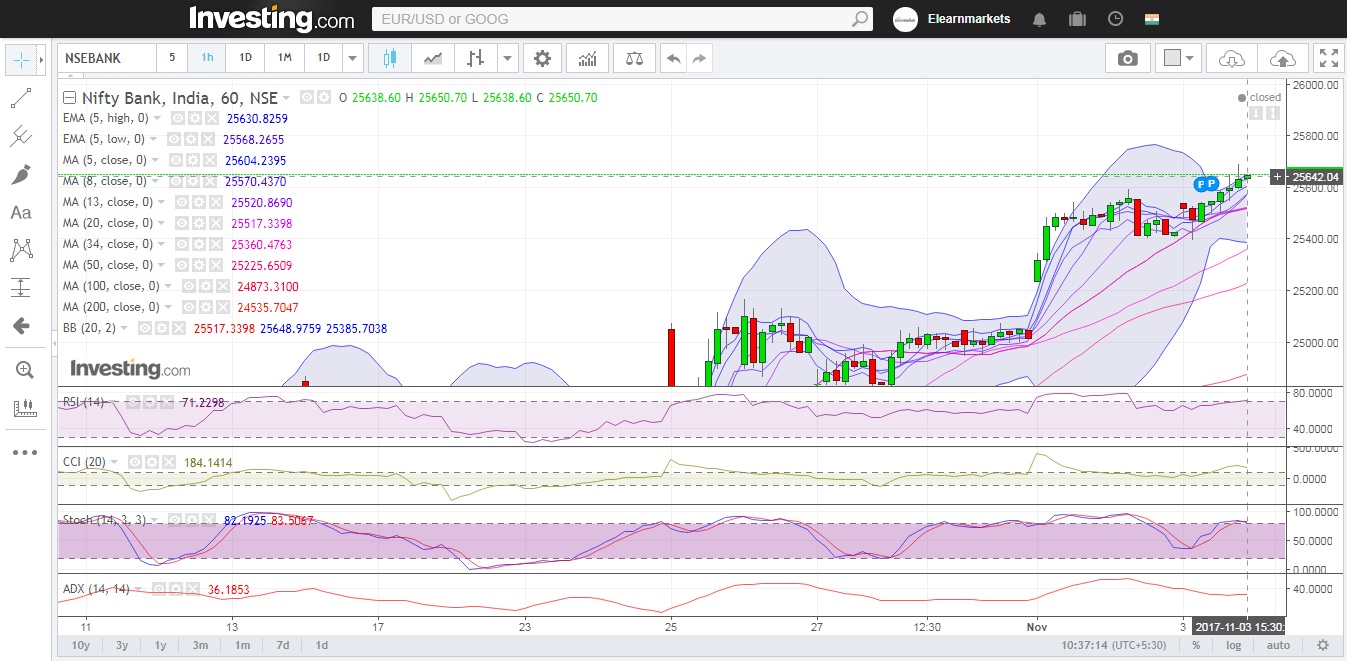
In the Hourly Chart, Bank Nifty has closed at its 5 hourly high EMA of (25650 approx).The Index is likely to find its next support area around its 5 hourly MA(25600). If Bank Nifty breaks and closes below the 5 hourly MA, it will find its next support around the 5 hourly low EMA(25568 approx).
Hourly RSI stands close to the higher end of the normal range. CCI however shows that sentiments are extremely positive. The ADX is indicating that volatility is likely.
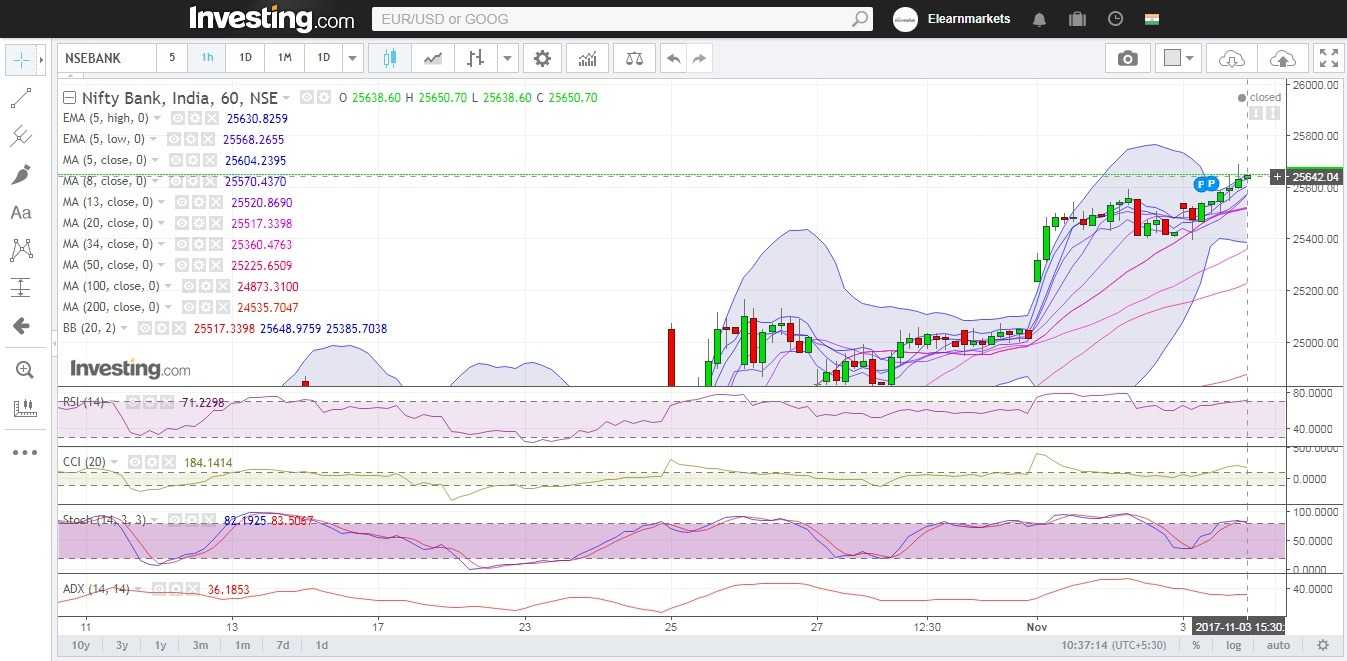
Figure: Bank Nifty Hourly Chart
Daily Technicals:
The daily chart indicates that Bank Nifty has closed above its 5 day high EMA of (25441 approx). If the Index breaks below its 5 DMA(25315 approx), the next support area will be the 5 day low EMA(25172 approx).
The daily RSI has closed towards the higher side of the normal range.The CCI however is indicating bullish setiments. The ADX indicates that momentum might be picking up.
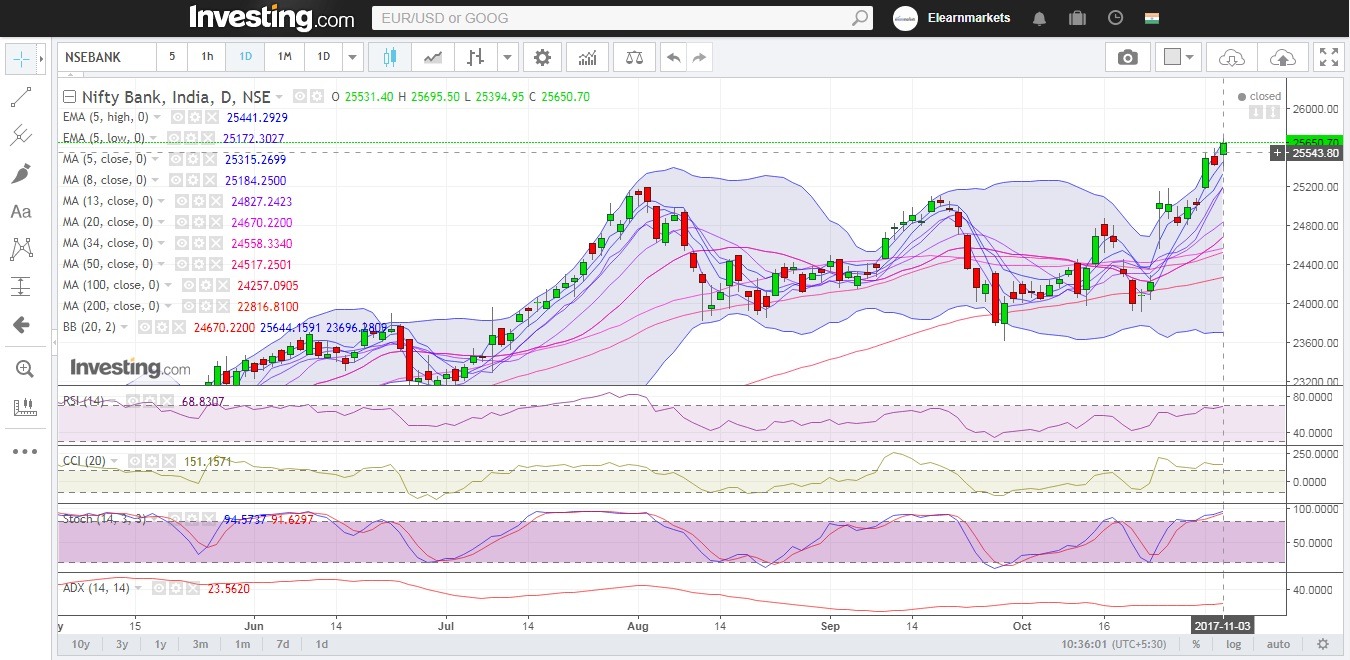
Figure: Bank-Nifty Daily Chart
Weekly Technicals:
In the Weekly Chart, Bank Nifty has closed convincingly above its upper bollinger band(25650 approx).The Index is likely to find its next support area around its upper bollinger band (25392 approx). If Bank Nifty breaks and closes below the 5 weekly high EMA(25139 approx), it will find its next support around the 5 weekly MA(25676 approx).
The weekly RSI has closed towards the higher side of the normal range.The CCI however is indicating bullish setiments. The ADX indicates that momentum might be picking up.
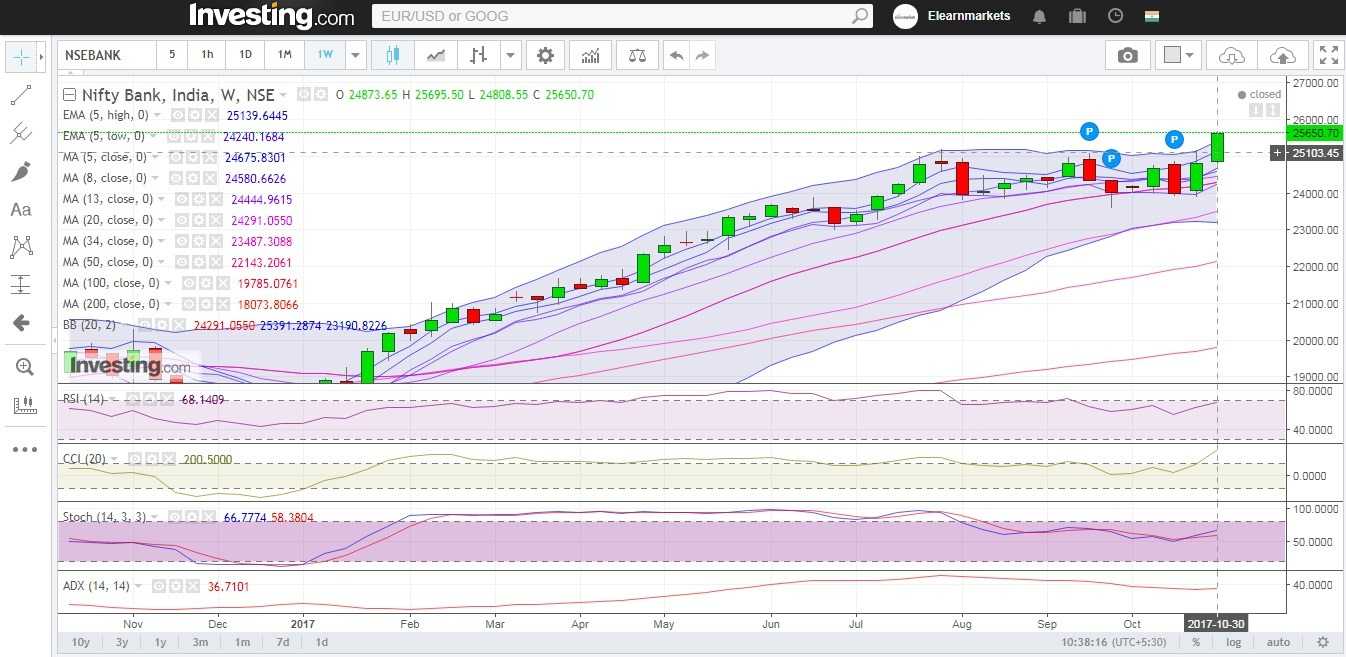
Figure: Bank-Nifty Weekly Chart
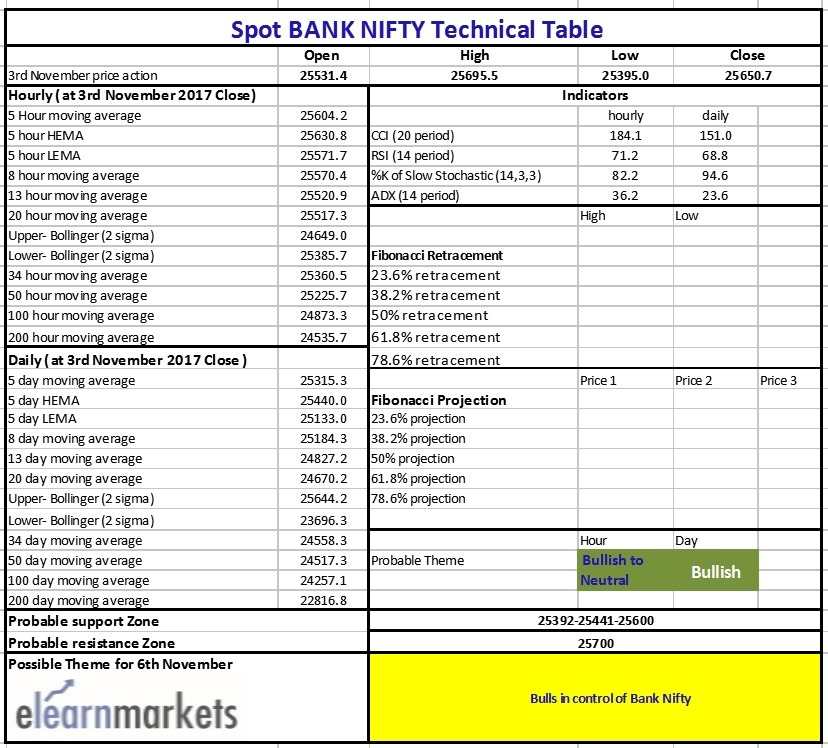
Figure: Bank-Nifty Tech Table
