Nifty close 9872.6: Nifty closed below 9900 in today session since the market sentiment was badly hit by likely worries over fiscal deficit. Bears took total control over bulls in today’s session and dragged Nifty down by 92 points on a closing basis.
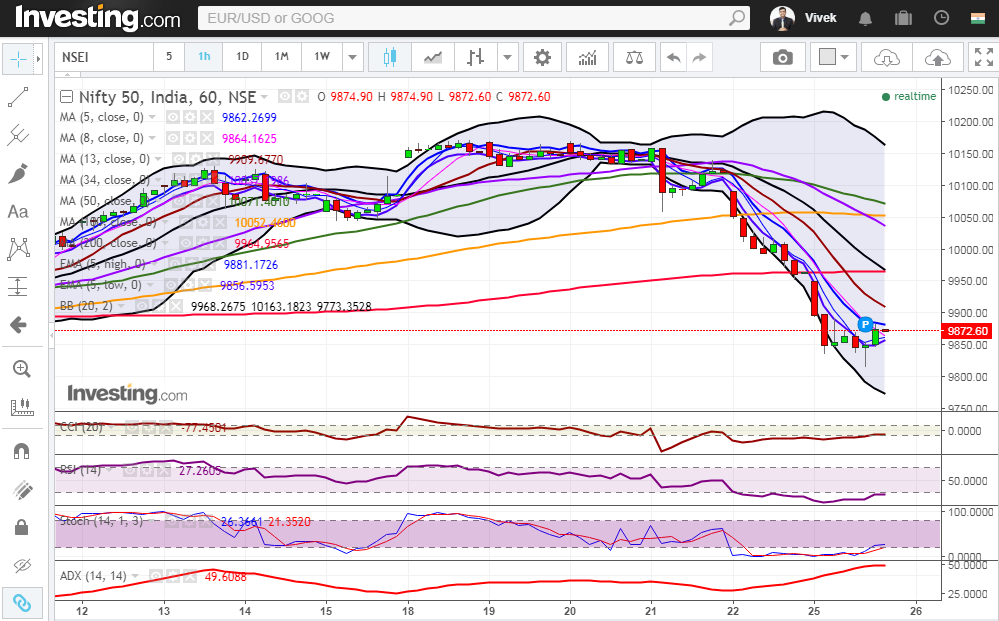
Hourly Technical:
In the Hourly chart, Nifty opened below 200 Hourly moving average and saw heavy decline. Presently Nifty is below most short term moving averages which is a sign of little worry in the hourly chart.
The probable support in the hourly chart comes at lower Bollinger line (presently at approx. 9773.3).
On the upside, Nifty may face resistance at 13 Hour moving average (presently at approx. 9909.6) and 200 Hour moving average (presently at approx. 9964.9.
Hourly Stochastic, RSI and CCI are still in the oversold zone and Hourly ADX is still up thus indicating gain in momentum. Overall Nifty remains Bearish in Hourly timeframe.
Figure: Daily Chart
Daily Technical:
In the daily chart, the close below 5 Day Low EMA and the 20 DMA (mid-Bollinger line) suggests more decline in the coming days. On the downside Nifty may find good support around 9700.
The probable support in the daily chart comes at Lower Bollinger line Hour moving average (presently at approx. 9790.8) and 100 DMA (presently at approx. 9758.8).

On the upside, Nifty may face resistance at 50 DMA (presently at approx. 9953.5), 5 Day Low EMA (presently at approx. 9966.9)and 20 DMA (presently at approx. 9998.4).
Daily RSI, Stochastic and CCI are very close to the lower bound of their respective range and ADX has again turned up thus indicating gain in momentum. Overall Nifty remains Bearish in Daily timeframe.
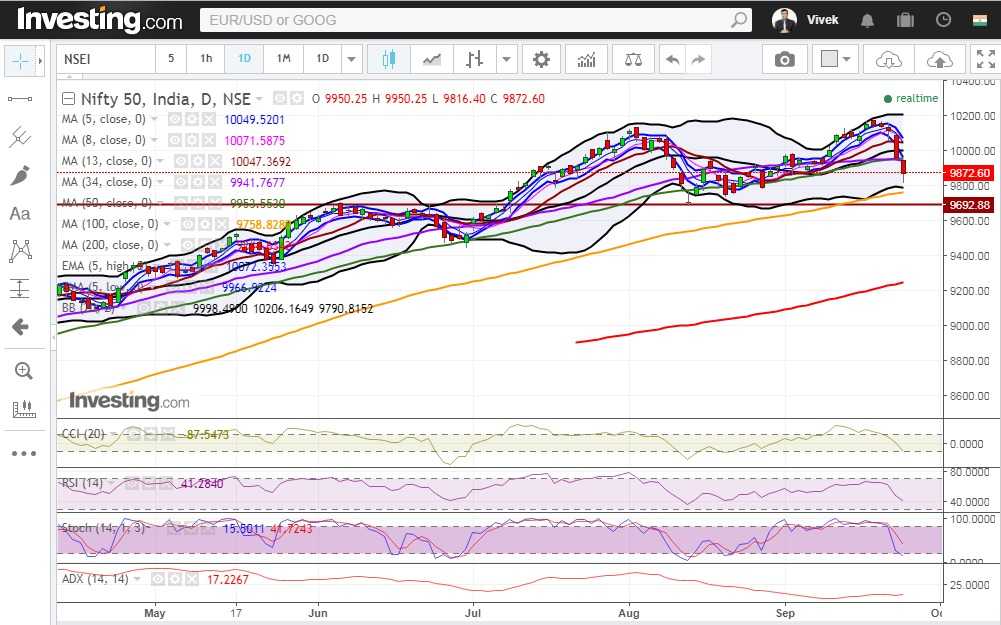
Figure: Daily Chart
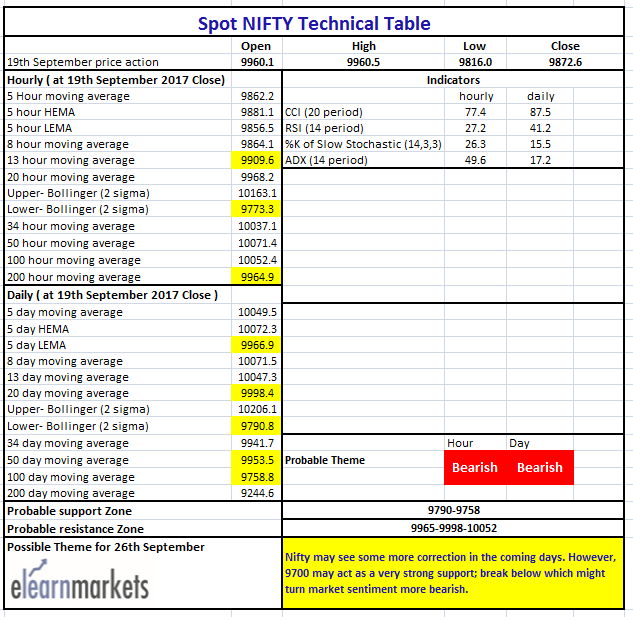
Figure: Tech Table


