Elearnmarkets - Financial Market Learning
  • Courses
  • Webinars
  • Stories
  • Language
    • English
    • Hindi
    • Bengali
No Result
View All Result
Get Free Course
  • Basic Finance
  • Derivatives
    • Futures
    • Options
  • Financial Planning
  • Fundamental Analysis
  • Technical Analysis
  • Mutual Funds
  • Marketshala
  • Miscellaneous
Elearnmarkets - Learn Stock Market, trading, investing for Free
  • Courses
  • Webinars
  • Stories
  • Language
    • English
    • Hindi
    • Bengali
No Result
View All Result
Get Free Course
Elearnmarkets - Learn Stock Market, trading, investing for Free
No Result
View All Result
Home Technical Analysis Market Analysis
Nifty Hourly Chart

Three Days Running Nifty Flirting With The All Time High Level

Elearnmarkets by Elearnmarkets
August 1, 2024
in Market Analysis, Market Wrap, Miscellaneous
Reading Time: 4 mins read
0
208
VIEWS
Share on FacebookShare on XShare on WhatsApp

Nifty close 10085.4: Nifty ends volatile session flat amid North Korea tensions. Nifty is likely to consolidate near its lifetime high for sometime before it will resume its next leg of up move.

As mentioned in last day’s report, Nifty took support from 5 DMA (at approx. 10040) in today’s session.
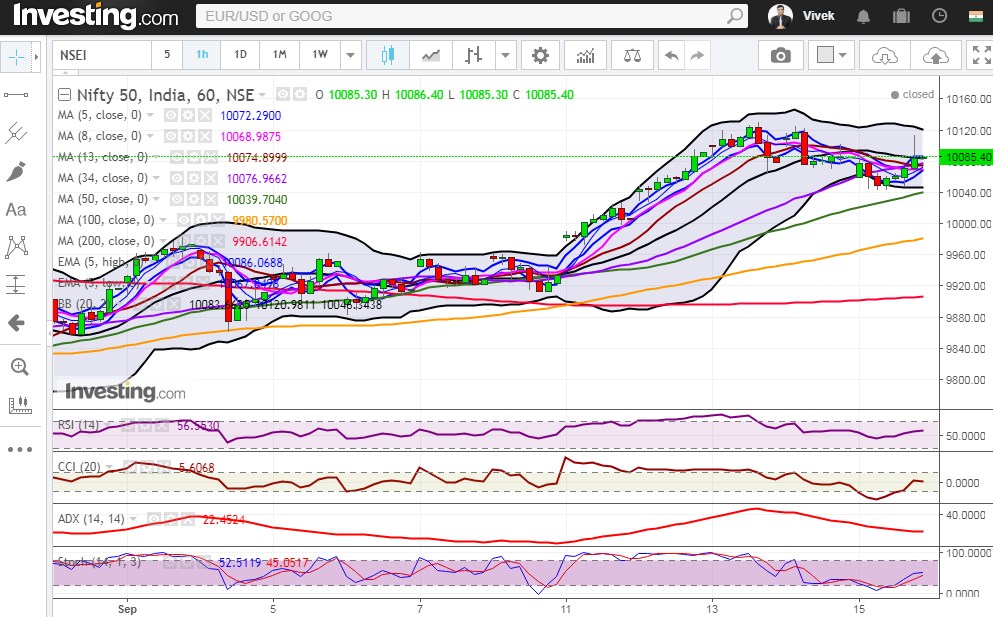
Hourly Technical:

Nifty recovered from its low in the second half of the trading day, however ,  this is the third time in the last three days, it faced resistance near its lifetime high.

The probable support in the hourly chart comes at 8 Hour moving average (presently at approx. 10068.9) and 50 Hour moving average (presently at approx. 10039.7).

On the upside, Nifty may face resistance at upper Bollinger line (presently at approx.10120.9).

Hourly CCI, RSI, Stochastic are in the normal zone.

Moreover, ADX indicates loss of momentum.

Overall Nifty remains Bullish to neutral in the  Hourly timeframe.

Hourly CCI, RSI, Stochastic are in the normal zone.

Moreover, ADX indicates loss of momentum.

Overall Nifty remains neutral to bullish in the Hourly timeframe.

Nifty neutral to bullish in the hourly timeframe


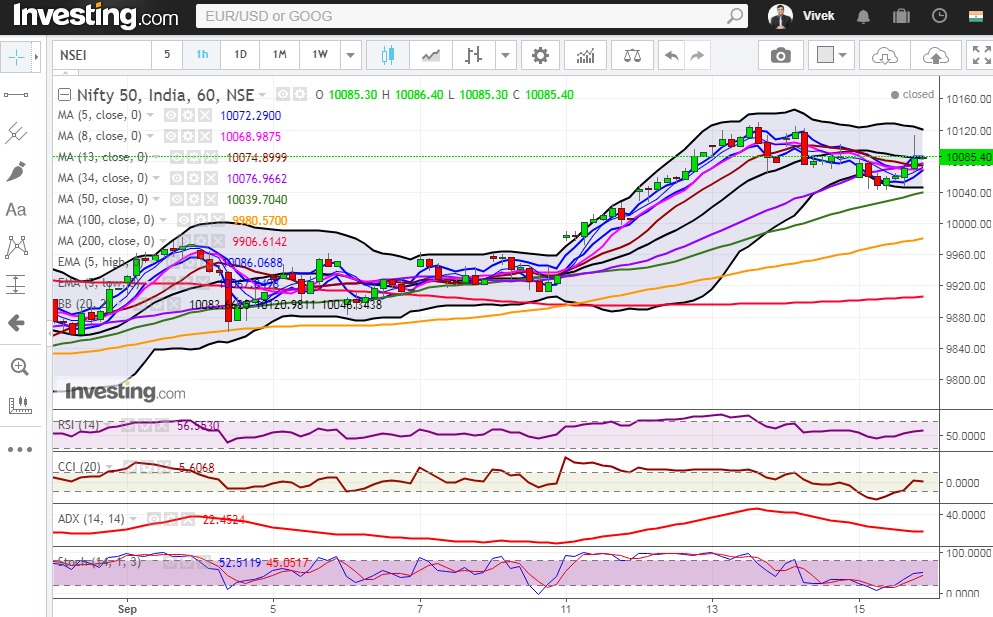
Figure: Hourly chart

Daily Technical:

In the daily chart, Nifty closed above most short-term moving averages but consolidating at the top.

The probable support in the daily chart comes at 5 DMA (presently at approx. 10070) and 5 Day Low EMA (presently at approx. 10026.9).

On the upside, Nifty may face resistance at upper Bollinger line (presently at approx. 10129.6).

Daily Stochastic and CCI are in the overbought zone and RSI is close to the upper bound of the normal zone.

Daily ADX has finally turned up thus indicating a gain in momentum, but this strength will increase once it goes above 20 levels.

Overall Nifty remains Bullish in the Daily timeframe.

Become a technical analysis expert by joining: NSE Academy Certified Technical Analysis course on Elearnmarkets.

We will include about MSCI Emerging market index from this week.
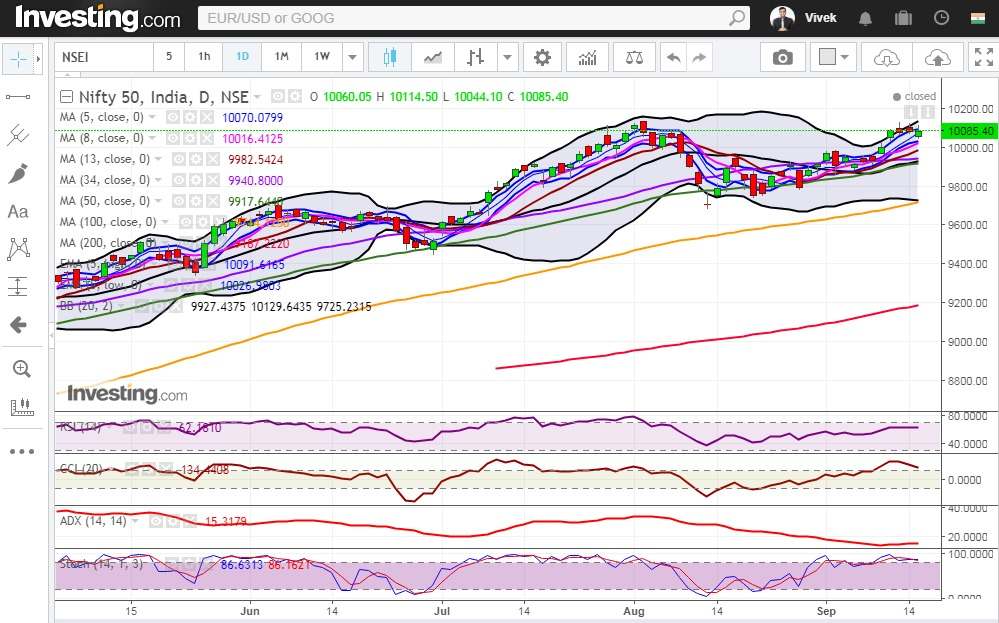
Three Days Running Nifty Flirting With The All Time High Level 1

Figure: Daily Chart

iShares MSCI Emerging Markets(Close, approx. 45.59): The MSCI Emerging market index looks bullish at present in daily chart. Based on Fibonacci projections

ishare MSCI emerging Daily chart

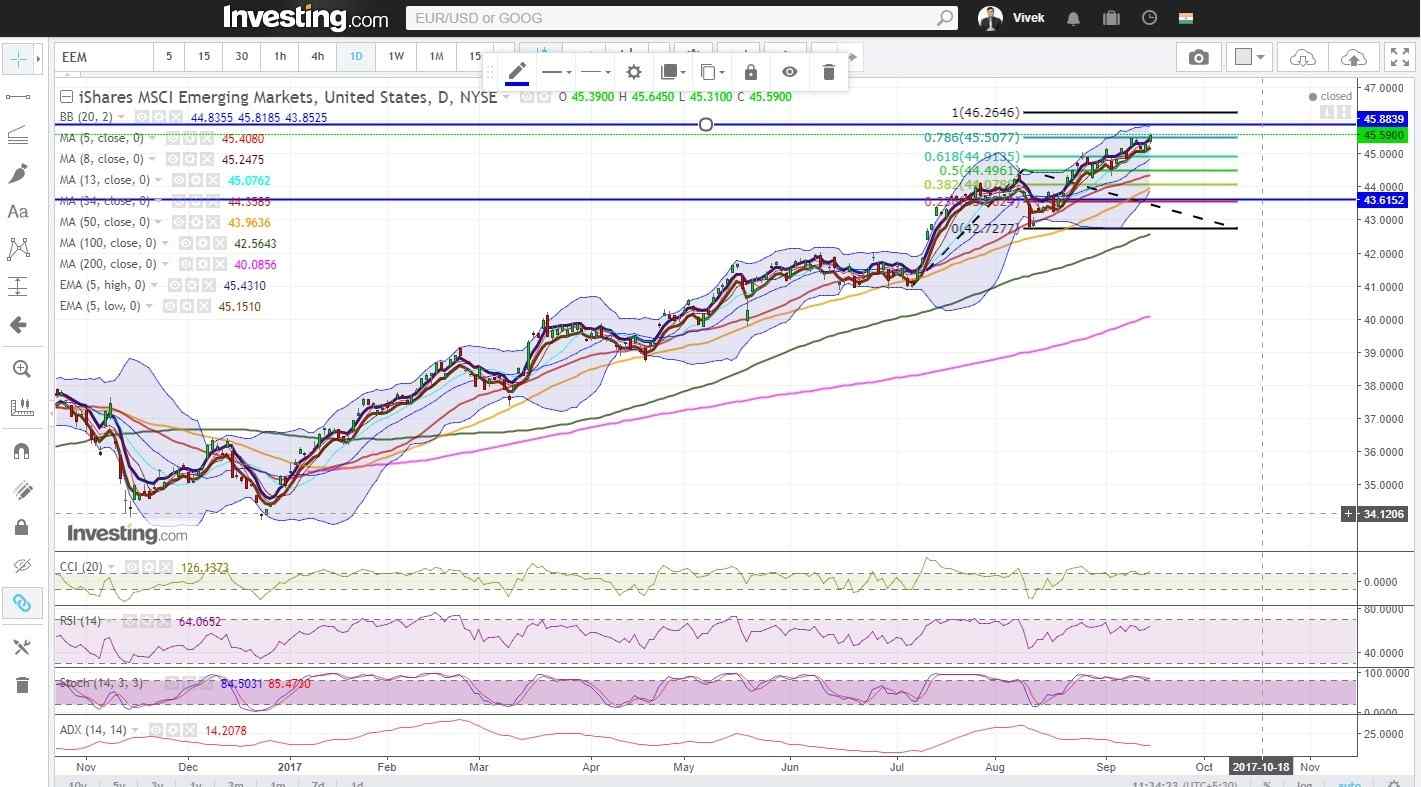
It can go up to 46.26, which is close to 1.8% higher from present close.


Figure: ishare MSCI Emerging Markets Daily Chart

Weekly Technical:

In the weekly chart, the bearish view due to the presence of long red candle in the first week of August has been totally negated in the last one month. The close above 5 Week High EMA (presently at approx. 10026.2) signals that bulls are strong in the weekly chart.

Weekly stochastic is close to the upper bound of the normal zone while CCI and RSI are already in the overbought zone. Overall Nifty remains firmly bullish in the weekly timeframe.

Three Days Running Nifty Flirting With The All Time High Level 2


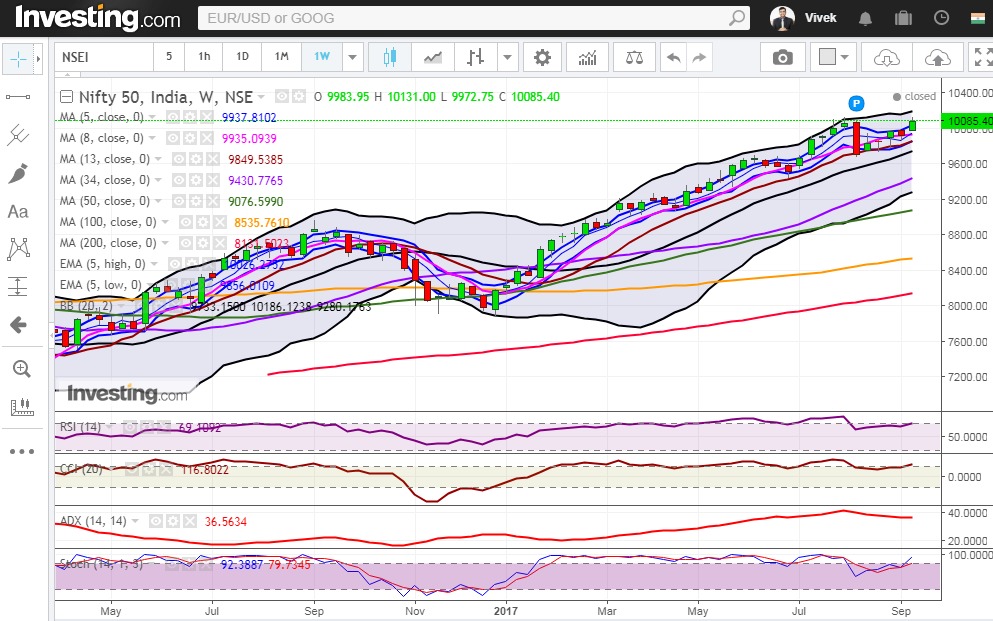
Figure: Weekly Chart

However, the weekly chart looks very interesting.

It is at a very crucial resistance level and the index got resistance between 43.60-45.90 since 2012.

A decisive move beyond 45.90 will open up strong bullish follow-up a possibility.

Three Days Running Nifty Flirting With The All Time High Level 3

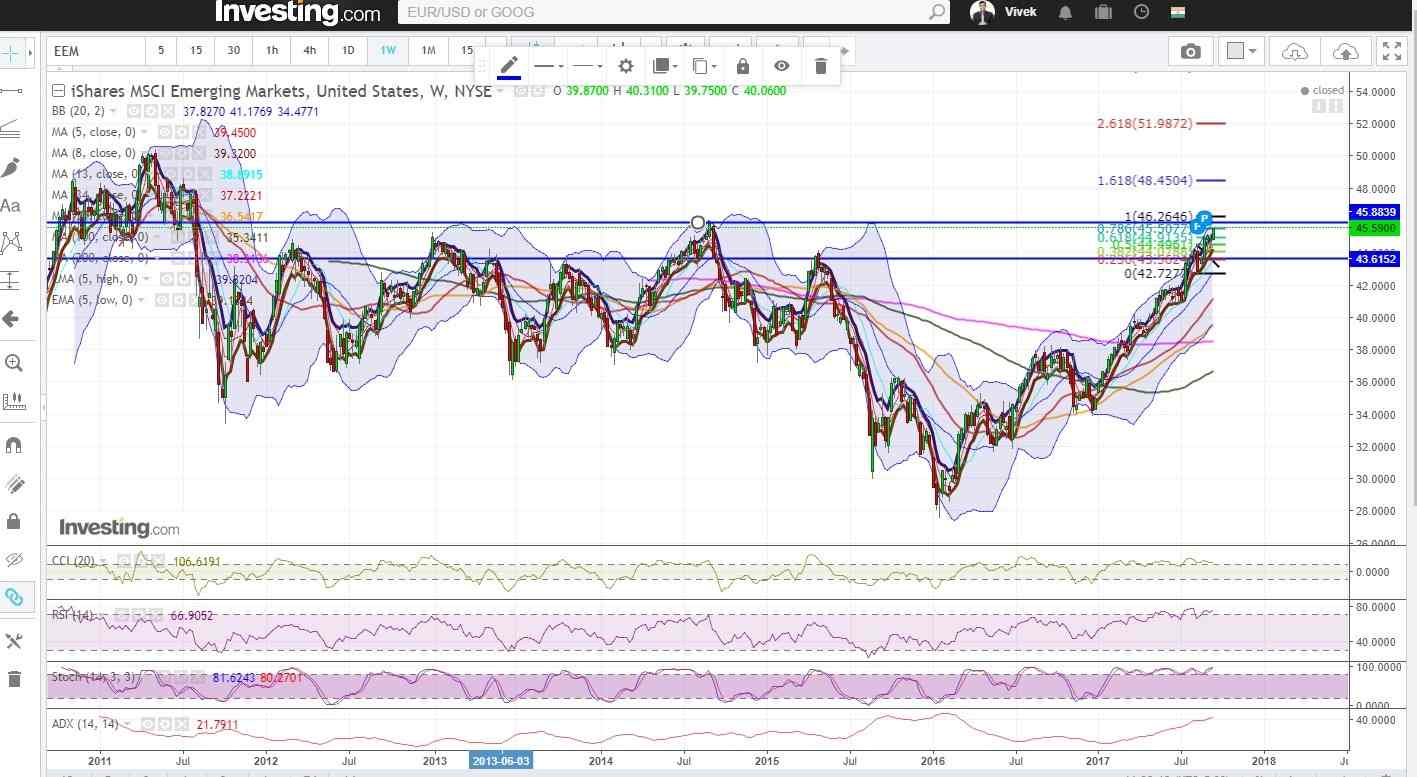
Figure: ishare MSCI Emerging Markets Weekly Chart
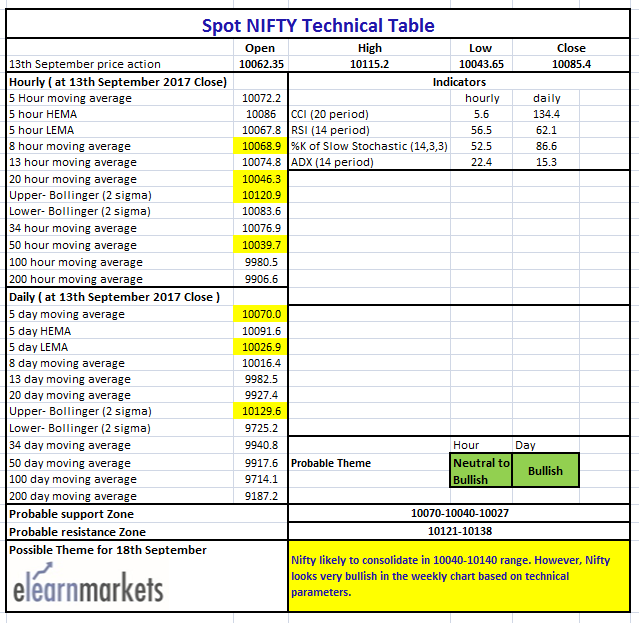
Nifty Tech Table
Figure: Tech Table

Watch the video below to interpret the above table:

Tags: english
ShareTweetSend
Get Kotak Offer Get Kotak Offer Get Kotak Offer
Previous Post

Bank Nifty On The Verge Of Testing Its Two Month High

Next Post

Calm Before Storm; Nifty Goes To Hibernation Before Fed Meeting

Elearnmarkets

Elearnmarkets

Elearnmarkets (ELM) is a complete financial market portal where the market experts have taken the onus to spread financial education. ELM constantly experiments with new education methodologies and technologies to make financial education effective, affordable and accessible to all. You can connect with us on Twitter @elearnmarkets.

Related Posts

Forex vs Stocks
Miscellaneous

Forex vs Stocks: Which Market Should You Trade First

May 13, 2025
103
Elearnmarkets's official social media handles
Miscellaneous

Official Social Media Handles of Eleanrmarkets

January 20, 2025
110
Best Personal loan Rates
Miscellaneous

5 Strategies for Finding the Best Personal Loan Rates

May 5, 2025
281
2008 Global Financial Crisis
Miscellaneous

The 2008 Global Financial Crisis

November 11, 2024
751

Leave a Reply Cancel reply

Your email address will not be published. Required fields are marked *

Disclaimer

Elearnmarkets (Kredent InfoEdge Pvt. Ltd.) is a SEBI-registered Research Analyst (RA) entity (SEBI Registration No.: INH300007493). The information provided in this article is for educational and informational purposes only and should not be considered as an offer to buy or sell any securities or investment products.

The stocks, securities, and investment instruments mentioned herein are not recommendations under SEBI (Research Analysts) Regulations, 2014. Readers are advised to conduct their own due diligence and seek independent financial advice before making any investment decisions.

Investments in securities markets are subject to market risks. Please read all related documents carefully before investing. Investing in Equity Shares,
Derivatives, Mutual Funds, or other instruments carry inherent risks, including potential loss of capital. Elearnmarkets (Kredent InfoEdge Pvt. Ltd.) does not provide any guarantee or assurance of returns on any investments. Past performance is not indicative of future performance.

Elearnmarkets Logo

Follow Us

Facebook-f X-twitter Instagram Linkedin-in Youtube Telegram

Register on Elearnmarkets

Continue your financial learning by creating your own account on Elearnmarkets.com

Register Free Account

Download App

Playstore logo
Download on app store

Categories

  • Basic Finance
  • Derivatives
  • Financial Planning
  • Fundamental Analysis
  • Technical Analysis
  • Mutual Funds
  • Miscellaneous

Popular On Elearnmarkets

  • Market Superheroes:
  • Vivek Bajaj
  • Chetan Panchamia
  • Ashish Kyal
  • Premal Parekh
  • Abhijit Paul
  • Jegan
  • Sivakumar Jayachadran
  • Jyoti Budhia
  • Vivek Gadodia
  • Vishal Mehta
  • Piyush Chaudhry
  • Santosh Pasi
  • Gomathi Shankar
  • Market Superheroes:
  • Vivek Bajaj
  • Chetan Panchamia
  • Ashish Kyal
  • Premal Parekh
  • Abhijit Paul
  • Jegan
  • Sivakumar Jayachadran
  • Jyoti Budhia
  • Vivek Gadodia
  • Vishal Mehta
  • Piyush Chaudhry
  • Santosh Pasi
  • Gomathi Shankar
  • Courses:​
  • Options Trading
  • Dow Theory
  • Momentum Trading
  • Stock Investing
  • Harmonic Chart Patterns
  • Algo Trading
  • Elliot Wave Theory
  • Advanced Excel
  • Cryptocurrency
  • NSE Certification Course
  • Courses:​
  • Options Trading
  • Dow Theory
  • Momentum Trading
  • Stock Investing
  • Harmonic Chart Patterns
  • Algo Trading
  • Elliot Wave Theory
  • Advanced Excel
  • Cryptocurrency
  • NSE Certification Course
  • Webinars:
  • Bank Nifty Scalping
  • Intraday Trading Strategies
  • Options Trading Strategies
  • Options selling
  • Price Action
  • Relative Strength
  • Tax Planning
  • Options Buying
  • Growth Stocks
  • Portfolio Management
  • Risk Management
  • Renko Charts
  • Crude Oil
  • Traders Psychology
  • Moving Average
  • Multibagger Stocks
  • Free Learning Modules:
  • Intraday Trading
  • Options Scalping
  • Swing Trading
  • Financial Modelling
  • RSI Indicator
  • Bollinger Bands
  • Pricing of Futures
  • Personal Finance
  • Initial Public Offerings (IPO)
  • Value Investing
  • Technical Indicators
  • Candlesticks
  • Chart Patterns
  • Option Greeks
  • ELSS Funds
  • Banking and Insurance
  • Real Estate
  • Gold
  • Book Summaries:
  • Rich Dad Poor Dad
  • Psychology of Money
  • The Intelligent Investor
  • The Richest Man in Babylon
  • Think and Trade Like a Champion
  • Value Investing and Behavioural Finance
  • Trading in the Zone
  • Learn to Earn
  • Book Summaries:
  • Rich Dad Poor Dad
  • Psychology of Money
  • The Intelligent Investor
  • The Richest Man in Babylon
  • Think and Trade Like a Champion
  • Value Investing and Behavioural Finance
  • Trading in the Zone
  • Learn to Earn
  • Tools:
  • CAGR Calculator
  • SIP Calculator
  • eLearnOptions
  • Future Value Calculator
  • Present Value Calculator
  • Atal Pension Yojana
  • Cost of Delay Calculator
  • Become a Crorepati
  • Tools:
  • CAGR Calculator
  • SIP Calculator
  • eLearnOptions
  • Future Value Calculator
  • Present Value Calculator
  • Atal Pension Yojana
  • Cost of Delay Calculator
  • Become a Crorepati

© 2025 Elearnmarkets. All Rights Reserved

  • Visit Elearnmarkets
  • Courses
  • Webinars
  • Financial Guides
  • Get Free Counselling
  • Visit Elearnmarkets
  • Courses
  • Webinars
  • Financial Guides
  • Get Free Counselling

Download Our App

No Result
View All Result
  • Article Categories
    • Basic Finance
    • Derivatives
    • Financial Planning
    • Fundamental Analysis
    • Technical Analysis
    • ETFs & Mutual Funds
    • Marketshala
    • Miscellaneous
  • Language
    • Hindi
    • Bengali
    • English
  • Courses
  • Webinars
  • Stories
Get Free Course

© 2024 Elearnmarkets All Rights Reserved

Guide Book on Investing with ₹ 5000
Learn about the Basics of Investments and Finance in this Ebook.
Download Guide For FREE
Trading Mentorship Program