Nifty close 10086.6 : Nifty opened above 10,100 level but could not sustain near its all time high and ended on a flat note. It is likely to consolidate near its lifetime high for sometime before it will resume its next leg of up move.
Hourly Technical:
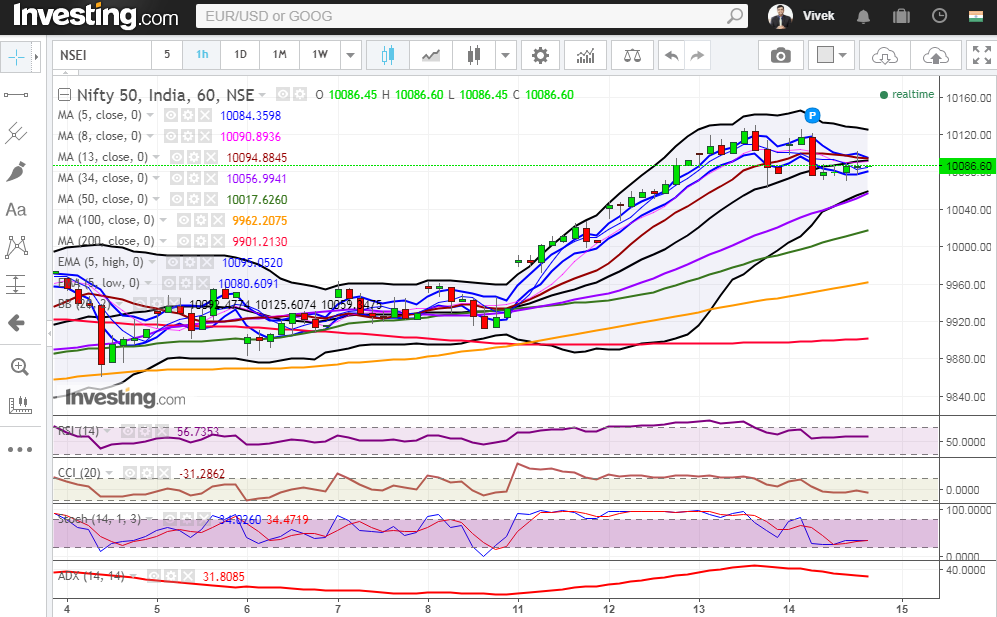
In today’s session, Nifty opened flat and sees profit booking near its life time high. The probable support in the hourly chart comes at 34 Hourly moving average (presently at approx. 10057) and 50 Hourly moving average (presently at approx. 10017.6).
On the upside, Nifty may face resistance at upper Bollinger line (presently at approx. 10125.6).
Hourly CCI, RSI, Stochastic are in the normal zone. Moreover, ADX indicates loss of momentum. Overall Nifty remains Bullish to neutral in Hourly timeframe.
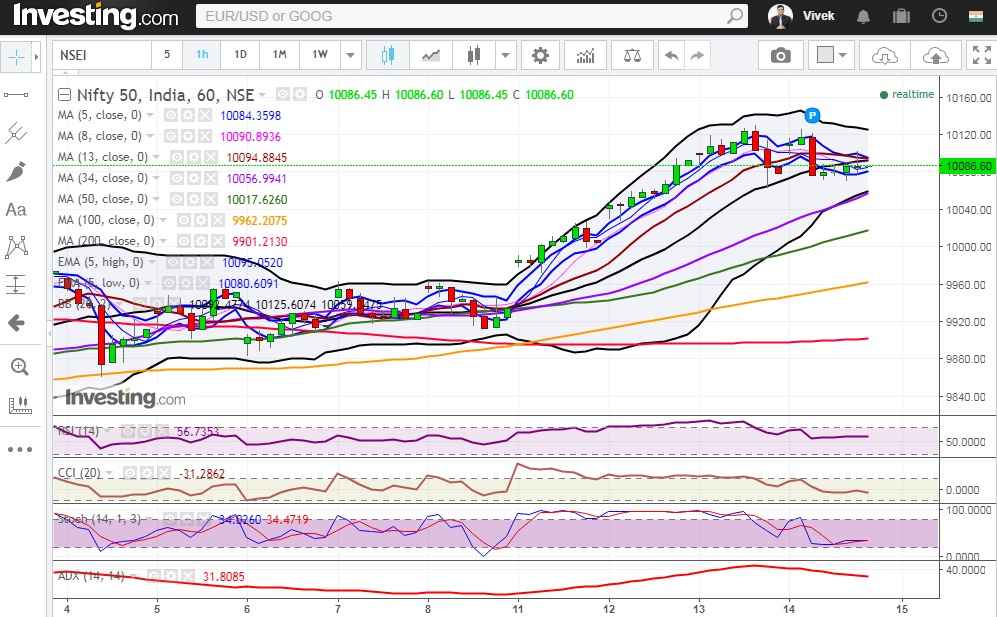
Figure: Hourly Chart
Daily Technical:
Nifty consolidates near its lifetime high which is acting as a resistance and today for the second time it could not breach the top.
The probable support in the daily chart comes at 5 DMA (presently at approx. 10040 and 5 Day Low EMA (presently at approx. 10018.5).
On the upside, Nifty may face resistance at all time high (at approx 10138).
Daily Stochastic and CCI are in overbought zone and RSI is close to the upper bound of the normal zone. Daily ADX has finally turned up thus indicating gain in momentum, but this strength will increase once it goes above 20 levels. Overall Nifty remains Bullish in Daily timeframe.

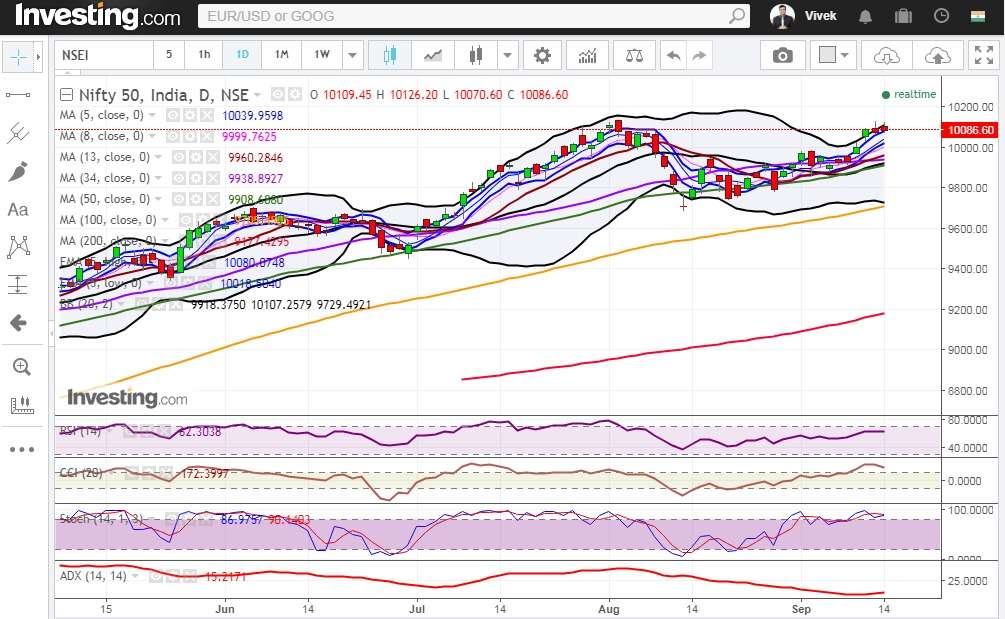
Figure: Daily Chart
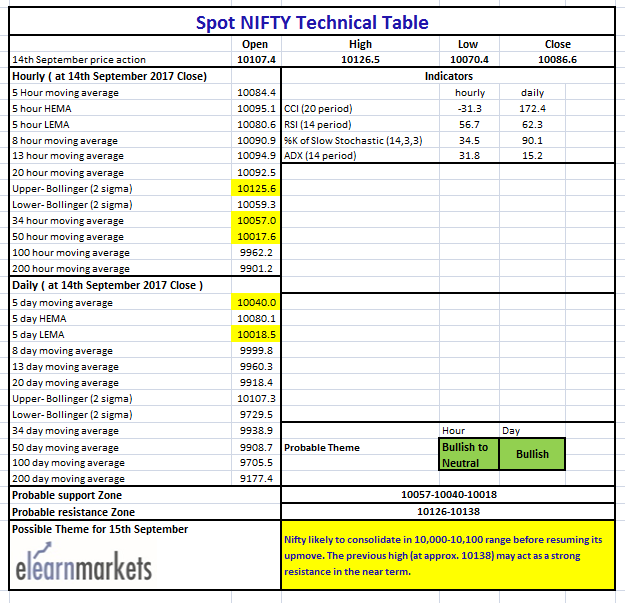
Figure: Tech Table


