Nifty (Close 9912.9) : Nifty fell sharply in today’s session after North Korea did powerful nuclear test on Sunday. In the second half, market saw some bounceback from its lows but closes below its important 200 Hourly moving average (presently at approx. 9916.4).
Hourly Technical:
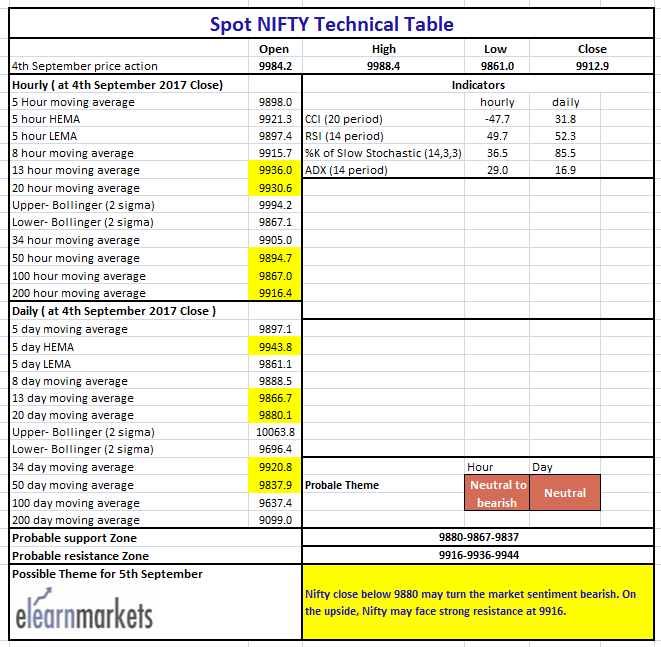
Nifty found support at 100 Hourly moving average (presently at approx. 9867) from where it saw some fresh buying after a massive selloff today. However, 200 Hourly moving average (presently at approx. 9916.4) may act as an important resistance in the short to medium term.
The probable support in the hourly chart comes at 100 Hourly moving average (presently at approx.9867). On the upside, Nifty may face resistance at 200 Hourly moving average (presently at approx. 9916.4) and 13 Hourly moving average (presently at approx.9936).
Hourly CCI, Stochastic, RSI are in the normal zone. Moreover, the falling ADX indicates fall in downside momentum. Overall, Nifty remains neutral to bearish in the Hourly chart.

Figure: Hourly Chart
Daily Technical
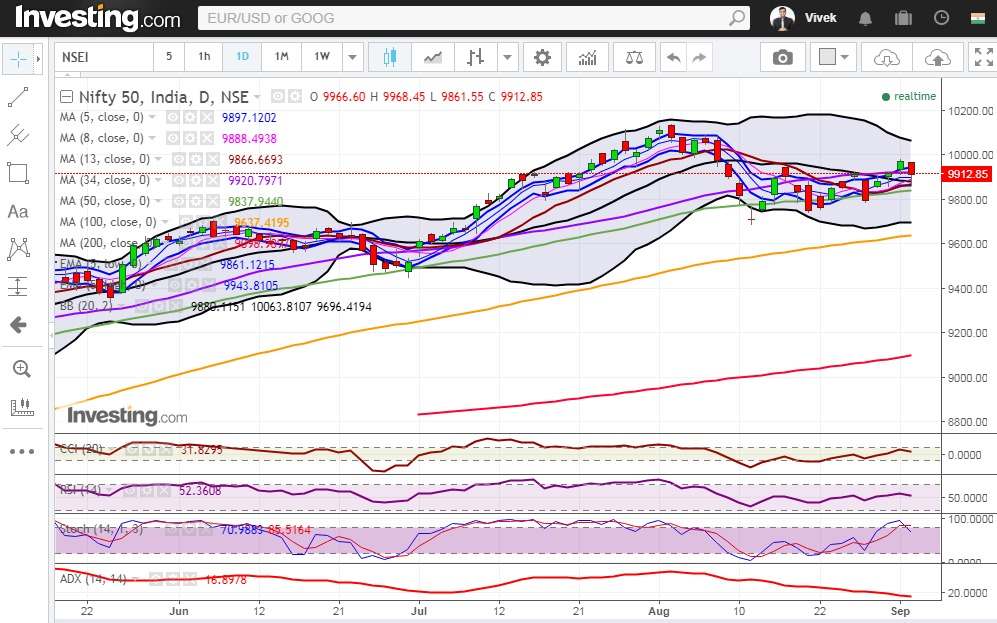
In the Daily chart, Nifty has again entered the 5 Day EMA high-low band, so we should wait to break on either side for clear direction. However, 20 DMA (presently at approx. 9880.1) may act as a crucial support in the daily chart, break below which may turn market sentiment bearish.
The probable support in the Daily chart comes at 13 DMA (presently at approx. 9867) and 50 DMA (presently at approx. 9837). On the upside, Nifty may face resistance at 34 DMA (presently at approx. 9921) and 5 Day High EMA (presently at approx.9943.8).
Daily CCI and RSI are in their respective normal zone but Stochastic is still in the overbought zone. Moreover, the falling ADX indicates fall In momentum. Overall, Nifty remains neutral in the Hourly chart.

Figure: Daily Chart

Figure: Tech Table


