Elearnmarkets - Financial Market Learning
  • Courses
  • Webinars
  • Stories
  • Language
    • English
    • Hindi
    • Bengali
No Result
View All Result
Get Free Course
  • Basic Finance
  • Derivatives
    • Futures
    • Options
  • Financial Planning
  • Fundamental Analysis
  • Technical Analysis
  • Mutual Funds
  • Marketshala
  • Miscellaneous
Elearnmarkets - Learn Stock Market, trading, investing for Free
  • Courses
  • Webinars
  • Stories
  • Language
    • English
    • Hindi
    • Bengali
No Result
View All Result
Get Free Course
Elearnmarkets - Learn Stock Market, trading, investing for Free
No Result
View All Result
Home Technical Analysis Market Analysis
Nifty Hourly Chart

Nifty Closes Above All Short-Term Moving Average; Bulls Back In Control

Elearnmarkets by Elearnmarkets
August 1, 2024
in Market Analysis, Market Wrap, Miscellaneous
Reading Time: 3 mins read
0
58
VIEWS
Share on FacebookShare on XShare on WhatsApp

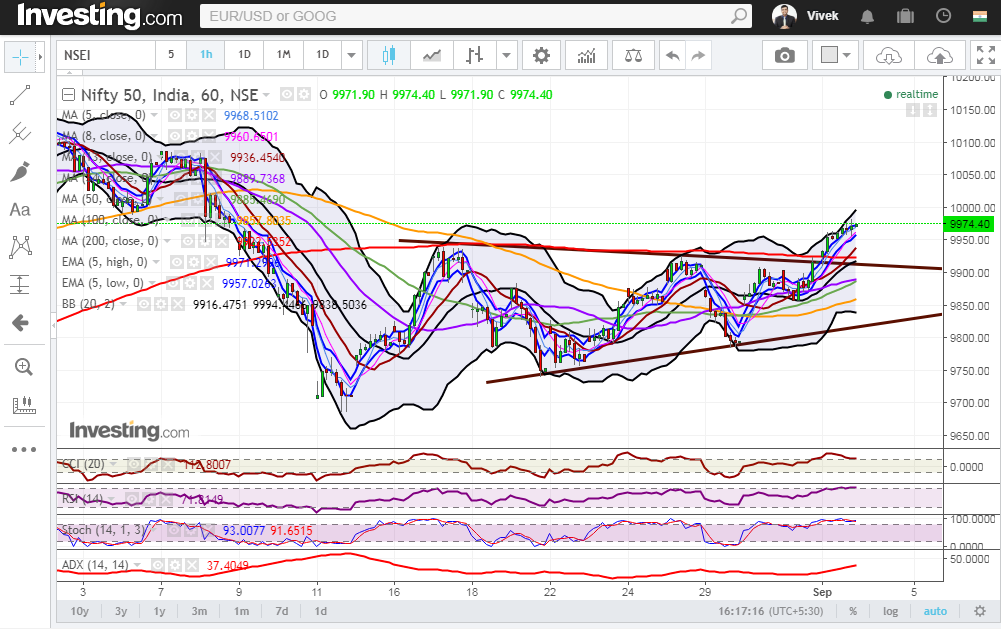
Nifty (Close 9974.4) : Nifty breached an importance resistance of 200 Hourly moving average (presently at approx. 9922.5) and  breaks out of the short-term Symmetrical triangle in the very first hour, post which it witnessed one-sided rally.

Hourly Technical:

Nifty has closed above all short term moving average and there is a high possibility that this rally may further continue.

The probable support in the hourly chart comes at 8 hour moving average (presently at approx.9960.7), 13 hour moving average (presently at approx.9936.5) and 200 hour moving average (presently at approx.9922.5). On the upside, Nifty may face resistance at upper Bollinger line (presently at approx.9994.4) and 78.6% retracement (presently at approx. 10041.5) of the down move from approx. 10137.9 to approx. 9687.5.

Hourly CCI, Stochastic, RSI are in the overbought zone. Moreover, the rising ADX indicates gain of upside momentum. Overall, Nifty remains bullish in the Hourly chart.

Nifty Closes Above All Short-Term Moving Average; Bulls Back In Control 1

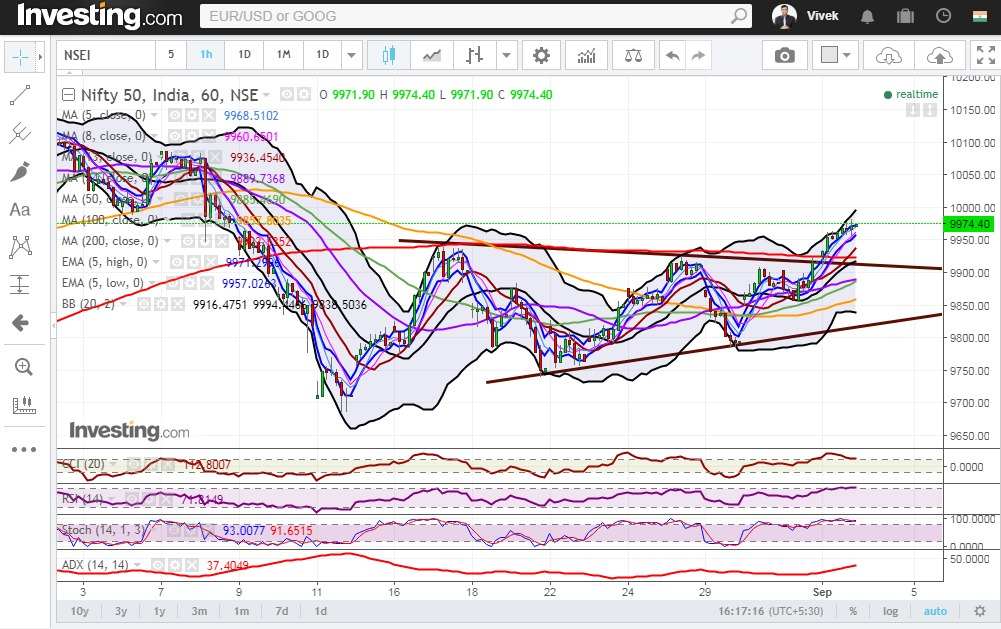
Figure: Hourly Chart

Daily Technical:

Nifty in the Daily chart has turned bullish and it seems that the bulls are once back in the game. Even in the Daily chart, Nifty has closed above most moving averages.

The probable support in the daily chart comes at 5 Day High EMA (presently at approx.9931.4), 34 DMA (presently at approx.9920) and 20 DMA (presently at approx.9885.2). The probable resistance in the daily chart comes at upper Bollinger line (presently at approx.10077.5).

The daily RSI and CCI are still in the neutral zone but gradually moving towards the upper bound of the normal zone. Daily stochastic has entered the overbought zone. However, the declining ADX indicates lack of momentum. Overall, Nifty remains bullish in the Daily chart.
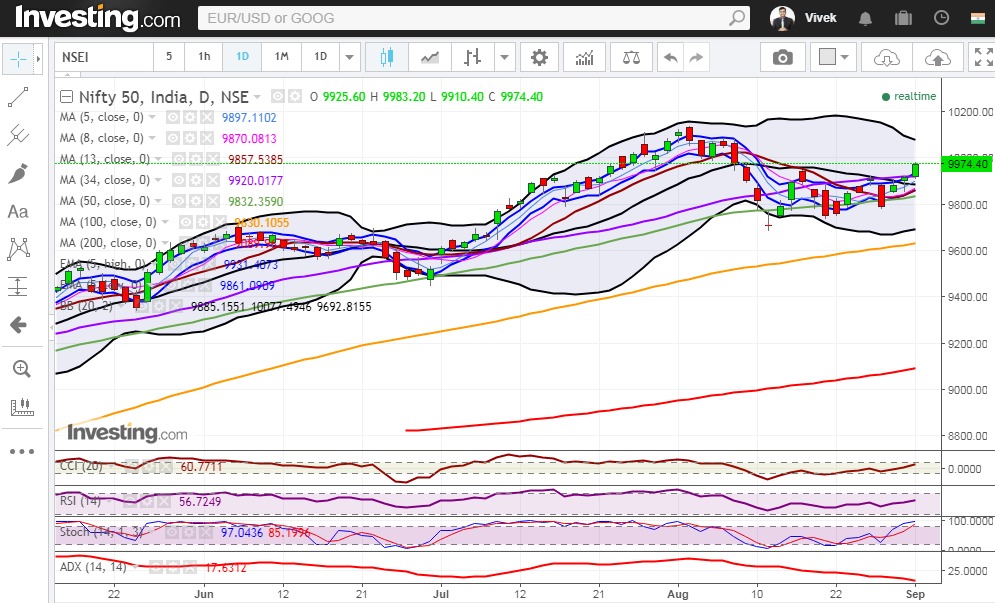
Nifty remains bullish Daily charts

Figure: Daily Chart

Weekly Technical:

In the weekly chart, the overall bearish view due to presence of long red candle last week has almost negated. The Nifty has closed just above 5 week High EMA (presently at approx. 9966.5) which is a sign of strength in the weekly chart.

Weekly CCI, RSI, slow stochastic are close to the upper bound of the normal zone. Overall, Nifty remains neutral to bullish in the weekly timeframe.

Nifty Closes Above All Short-Term Moving Average; Bulls Back In Control 2

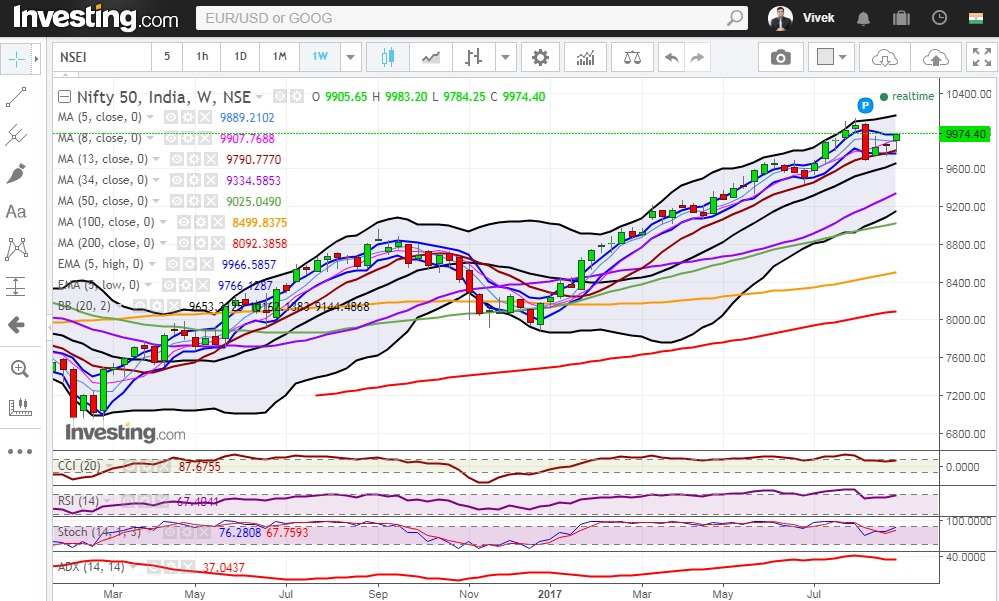
Figure: Weekly Chart
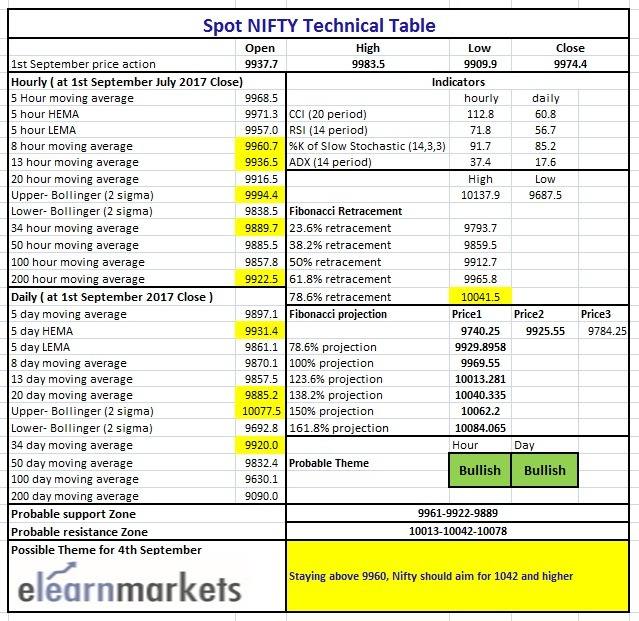
Nifty Closes Above All Short-Term Moving Average; Bulls Back In Control 3

Figure: Tech Table

Tags: english
ShareTweetSend
Get Kotak Offer Get Kotak Offer Get Kotak Offer
Previous Post

How to generate powerful trading signals using Parabolic SAR and RSI?

Next Post

Bank Nifty Looks All Set To 25200 Levels

Elearnmarkets

Elearnmarkets

Elearnmarkets (ELM) is a complete financial market portal where the market experts have taken the onus to spread financial education. ELM constantly experiments with new education methodologies and technologies to make financial education effective, affordable and accessible to all. You can connect with us on Twitter @elearnmarkets.

Related Posts

Forex vs Stocks
Miscellaneous

Forex vs Stocks: Which Market Should You Trade First

May 13, 2025
113
Elearnmarkets's official social media handles
Miscellaneous

Official Social Media Handles of Eleanrmarkets

January 20, 2025
111
Best Personal loan Rates
Miscellaneous

5 Strategies for Finding the Best Personal Loan Rates

May 5, 2025
282
2008 Global Financial Crisis
Miscellaneous

The 2008 Global Financial Crisis

November 11, 2024
751

Leave a Reply Cancel reply

Your email address will not be published. Required fields are marked *

Disclaimer

Elearnmarkets (Kredent InfoEdge Pvt. Ltd.) is a SEBI-registered Research Analyst (RA) entity (SEBI Registration No.: INH300007493). The information provided in this article is for educational and informational purposes only and should not be considered as an offer to buy or sell any securities or investment products.

The stocks, securities, and investment instruments mentioned herein are not recommendations under SEBI (Research Analysts) Regulations, 2014. Readers are advised to conduct their own due diligence and seek independent financial advice before making any investment decisions.

Investments in securities markets are subject to market risks. Please read all related documents carefully before investing. Investing in Equity Shares,
Derivatives, Mutual Funds, or other instruments carry inherent risks, including potential loss of capital. Elearnmarkets (Kredent InfoEdge Pvt. Ltd.) does not provide any guarantee or assurance of returns on any investments. Past performance is not indicative of future performance.

Elearnmarkets Logo

Follow Us

Facebook-f X-twitter Instagram Linkedin-in Youtube Telegram

Register on Elearnmarkets

Continue your financial learning by creating your own account on Elearnmarkets.com

Register Free Account

Download App

Playstore logo
Download on app store

Categories

  • Basic Finance
  • Derivatives
  • Financial Planning
  • Fundamental Analysis
  • Technical Analysis
  • Mutual Funds
  • Miscellaneous

Popular On Elearnmarkets

  • Market Superheroes:
  • Vivek Bajaj
  • Chetan Panchamia
  • Ashish Kyal
  • Premal Parekh
  • Abhijit Paul
  • Jegan
  • Sivakumar Jayachadran
  • Jyoti Budhia
  • Vivek Gadodia
  • Vishal Mehta
  • Piyush Chaudhry
  • Santosh Pasi
  • Gomathi Shankar
  • Market Superheroes:
  • Vivek Bajaj
  • Chetan Panchamia
  • Ashish Kyal
  • Premal Parekh
  • Abhijit Paul
  • Jegan
  • Sivakumar Jayachadran
  • Jyoti Budhia
  • Vivek Gadodia
  • Vishal Mehta
  • Piyush Chaudhry
  • Santosh Pasi
  • Gomathi Shankar
  • Courses:​
  • Options Trading
  • Dow Theory
  • Momentum Trading
  • Stock Investing
  • Harmonic Chart Patterns
  • Algo Trading
  • Elliot Wave Theory
  • Advanced Excel
  • Cryptocurrency
  • NSE Certification Course
  • Courses:​
  • Options Trading
  • Dow Theory
  • Momentum Trading
  • Stock Investing
  • Harmonic Chart Patterns
  • Algo Trading
  • Elliot Wave Theory
  • Advanced Excel
  • Cryptocurrency
  • NSE Certification Course
  • Webinars:
  • Bank Nifty Scalping
  • Intraday Trading Strategies
  • Options Trading Strategies
  • Options selling
  • Price Action
  • Relative Strength
  • Tax Planning
  • Options Buying
  • Growth Stocks
  • Portfolio Management
  • Risk Management
  • Renko Charts
  • Crude Oil
  • Traders Psychology
  • Moving Average
  • Multibagger Stocks
  • Free Learning Modules:
  • Intraday Trading
  • Options Scalping
  • Swing Trading
  • Financial Modelling
  • RSI Indicator
  • Bollinger Bands
  • Pricing of Futures
  • Personal Finance
  • Initial Public Offerings (IPO)
  • Value Investing
  • Technical Indicators
  • Candlesticks
  • Chart Patterns
  • Option Greeks
  • ELSS Funds
  • Banking and Insurance
  • Real Estate
  • Gold
  • Book Summaries:
  • Rich Dad Poor Dad
  • Psychology of Money
  • The Intelligent Investor
  • The Richest Man in Babylon
  • Think and Trade Like a Champion
  • Value Investing and Behavioural Finance
  • Trading in the Zone
  • Learn to Earn
  • Book Summaries:
  • Rich Dad Poor Dad
  • Psychology of Money
  • The Intelligent Investor
  • The Richest Man in Babylon
  • Think and Trade Like a Champion
  • Value Investing and Behavioural Finance
  • Trading in the Zone
  • Learn to Earn
  • Tools:
  • CAGR Calculator
  • SIP Calculator
  • eLearnOptions
  • Future Value Calculator
  • Present Value Calculator
  • Atal Pension Yojana
  • Cost of Delay Calculator
  • Become a Crorepati
  • Tools:
  • CAGR Calculator
  • SIP Calculator
  • eLearnOptions
  • Future Value Calculator
  • Present Value Calculator
  • Atal Pension Yojana
  • Cost of Delay Calculator
  • Become a Crorepati

© 2025 Elearnmarkets. All Rights Reserved

  • Visit Elearnmarkets
  • Courses
  • Webinars
  • Financial Guides
  • Get Free Counselling
  • Visit Elearnmarkets
  • Courses
  • Webinars
  • Financial Guides
  • Get Free Counselling

Download Our App

No Result
View All Result
  • Article Categories
    • Basic Finance
    • Derivatives
    • Financial Planning
    • Fundamental Analysis
    • Technical Analysis
    • ETFs & Mutual Funds
    • Marketshala
    • Miscellaneous
  • Language
    • Hindi
    • Bengali
    • English
  • Courses
  • Webinars
  • Stories
Get Free Course

© 2024 Elearnmarkets All Rights Reserved

Guide Book on Investing with ₹ 5000
Learn about the Basics of Investments and Finance in this Ebook.
Download Guide For FREE
Trading Mentorship Program