Stock markets are very volatile but as we know that they are the ones who have been providing us with consistent returns beating many kinds of alternate Investment tools like FD, EPF, PPF etc.
Whenever we speak about stock market Investment or read about the same, one question that plagues all minds is what its right price should be for investment and how one can quantify stock price calculation.
Whether it will give good returns or not.
How much can it grow etc.
But one more thing which is very important to know about a company is its Qualitative criteria.
A fatal mistake is, when one neither understands the Qualitative nor the Quantitative criteria of the company
| Table of Contents |
|---|
| Stock Price Calculation Example |
| Disclaimer |
But invests into it at a wrong price expecting a major kind of return.
No one wants to get stuck in the wrong Investment. So let us understand the difference between the wrong and the right investment.
This is a very apt kind of an Investment philosophy where you need to check whether or not that stock can fulfil your return expectations.
So let us take an example where we want to invest in only that stock which can give us a 25% kind of return every year for over 10 years.
Now this return can only happen if the earnings also support the stock.
So from the very beginning itself we should do our homework first before Investing and check out if our return expectation can be fulfilled by the company or not taking into account its historical returns.
Stock Price Calculation Example:
So let us take a case study of Bajaj Auto as our expected investment and do stock price calculation.
Now, we will take price of Bajaj Auto is Rs 2,731 and its trailing twelve month EPS is Rs. 180.11 thus the PE comes to 15.16x (Price / EPS or 2731/180.11)
Now since we expect to make 25% kind of return from the stock thus our stock price calculation after 10 years should be FV=PV(1+r)^n which means FV=(2731+0.25)^10=Rs 25,434.4
Evaluate your investments with Stock investing made easy Course by Market Experts
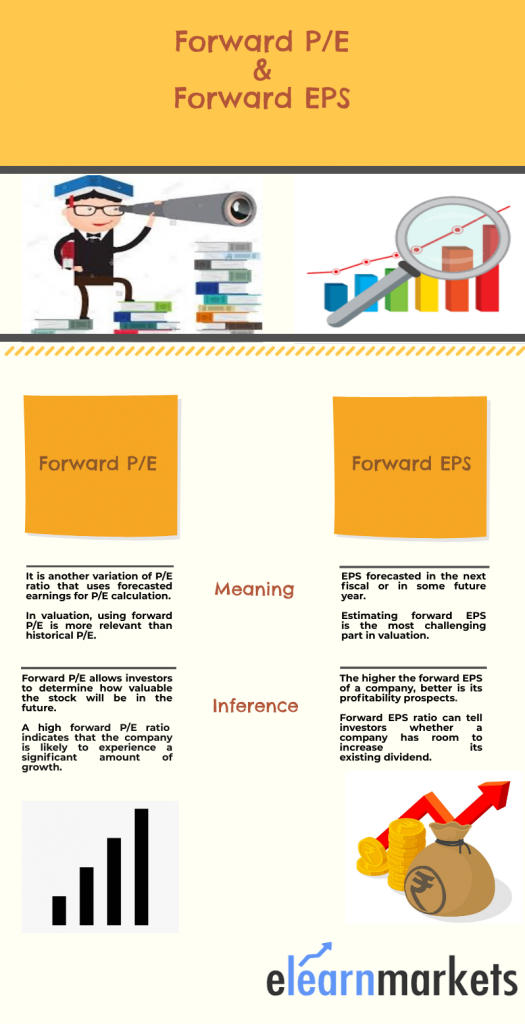
Suppose the maximum PE ratio at which we want to sell the stock is 17x times (as that has been the historic PE of the company). Thus at current price of Rs 25,434.4 the EPS of the stock would be 25434.4/25 or Rs 1496.14
From EPS of 180.11 to EPS of Rs 1496.14 in ten years means a CAGR growth of = ((FV/PV) ^ (1/n)-1)
Which means a CAGR growth of ((1496.14/180.11) ^ (1/10)-1) = 23%
Now one thing which we need to ask ourselves is that can Bajaj Auto EPS grow at a CAGR of 23%
You can also calculate CAGR our CAGR Calculator.
So for that we need to check its historic EPS growth which can be taken from any company’s Annual Reports.
So in this case we find that the historic EPS growth for Bajaj Auto for the last 10 years has mostly been in single digits.
Thus investment in this company may not give us our desired expectation of 25% kind of returns as the earnings are not suggestive of double digit growth so far.
Disclaimer:
There can be chances that the P/E multiple of the stock can rise further as a decade is a long time.
Also, historical performance cannot be the only barometer for future growth.
Thus every theory has its pros and cons but still homework is a must as that helps us to filter out stocks better opportunities.
Thus now does it not become easy for you to decide whether the stock can fulfil your return expectations or not.
In the similar manner you can also compare various stocks and their return potential and then invest into the one which can fulfil your return criteria.
Key Takeaways:
- If our stock market Investment is well thought of and proper stock price calculation is done, then our chances of getting stuck in the wrong ones are lesser.
- One should always do their homework first before investing in any stock.
- One should always know the earning capacity of any company in which they want to invest.
- Historic data is very important to check out on future expectation from any company.
You can learn more such concepts under one roof through our certificate course on valuation.
Happy Learning!


