Profitability ratios are financial ratios that are used by the investors for evaluating a company’s ability for generating income profit in relation to its revenue, operating costs, balance sheet assets, and equity shareholders during a particular period of time.
These ratios tell the investors how well a company is using its assets for generating profit and value to its shareholders.
A higher ratio is preferred as it usually means that the business is performing well by generating profits, and cash flow.
The ratios help in comparing similar companies of the same sector.
7 most used Profitability Ratios:

1. Return on Equity:
This ratio is the percentage of net income to the stockholders’ equity or can be expressed as the rate of return on the money which the equity investors have put in the business of the company.
The ROE ratio is the most-watched ratio by the investors as the high ROE denotes a reason for purchasing a company’s stock. As the companies with a high ROE are more capable of generating cash internally, and therefore less dependent on debt financing.
The formula of ROE is Profit after Tax ÷ Net worth Where, Net worth = Equity share capital, and Reserve and Surplus
2. Dividend Per Share:
This profitability ratio shows the amount of dividend that is distributed to its shareholders by the company. The high ratio shows that the company has surplus cash.
The formula for calculating dividend per share is Amount Distributed to Shareholders ÷ No of Shares outstanding.
3. Price Earnings Ratio:
Investors use this profitability ratio for checking the undervalued as well as the overvalued share price of the company.
This ratio also shows the expectations about the company’s earnings and also the payback period to the investors.
The formula for calculating the Price Earnings Ratio is Market Price of Share ÷ Earnings per share
For investors who want to purchase financially sound companies that give a good return on investment, the P/E is part of the research process to select the stocks as they can find out whether they are paying a fair price.
One can easily use this ratio when they are trying to value a company using earnings. When they find a high or a low P/E they can easily assess what kind of stock or company they are dealing with.
Those companies with high Price Earnings Ratios are considered to be growth stocks as it indicates a positive future performance.
4. Return on Capital Employed:
This profitability ratio shows the return in the company on the funds that are invested in the business by the owners.
A high Return on Capital Employed ratio represents the company better as it indicates that more profits are generated per rupee of capital employed.
The formula for calculating ROCE is: Net Operating Profit ÷ Capital Employed × 100
Capital Employed = Equity share capital, Reserve and Surplus, Debentures and long-term Loans or Capital Employed = Total Assets – Current Liability
Like other financial ratios, just calculating the ROCE is not enough. Other profitability ratios like return on assets, return on invested capital, and return on equity should be used with ROCE for determining if a company is likely a good investment or not.
5. Return on Assets:
Return on assets (ROA) is a profitability ratio that shows the percentage of net earnings in relation to the company’s total assets.
The ROA ratio indicates how much after-tax profit a company is generating for every rupee of assets it holds and also measures the asset intensity of the business.
When the company has a lower profit per rupee of assets, then the company is considered to be more asset-intensive. The highly asset-intensive companies require big investments for purchasing machinery and equipment to generate income.
Watch our Webinar on TOP 10 RATIOS IN FUNDAMENTAL ANALYSIS
6. Net Profit Margin:
Net profit margin is the profitability ratio that looks at a company’s net income and then divides it by total revenue. It indicates how profitable a company is after its expenses including interest and taxes.
One should look at the net profit margin as a profitability ratio as it takes everything into account. The main drawback of this ratio is that it includes a lot of “noise” like one-time expenses and gains, which makes it harder for comparing a company’s performance with its competitors.
7. Operating Profit Margin:
Operating profit margin is a profitability ratio that looks at earnings as a percentage of sales before interest expense and income taxes are reduced.
Companies which have higher operating profit margins are more well-equipped for paying for fixed costs and interest on obligations, thus they have better chances for surviving an economic slowdown.
Operating profit margin is mainly used for analyzing the strength of management of the company as good management can improve the company’s profitability by managing its operating costs.
For more detailed Learning on Ratio Analysis, you can check our course- Ratio Analysis Made Easy
Where to check the above Profitability ratios of a company?
The investor can check the above profitability ratios of any company in which they want to invest for the long-term using StockEdge.
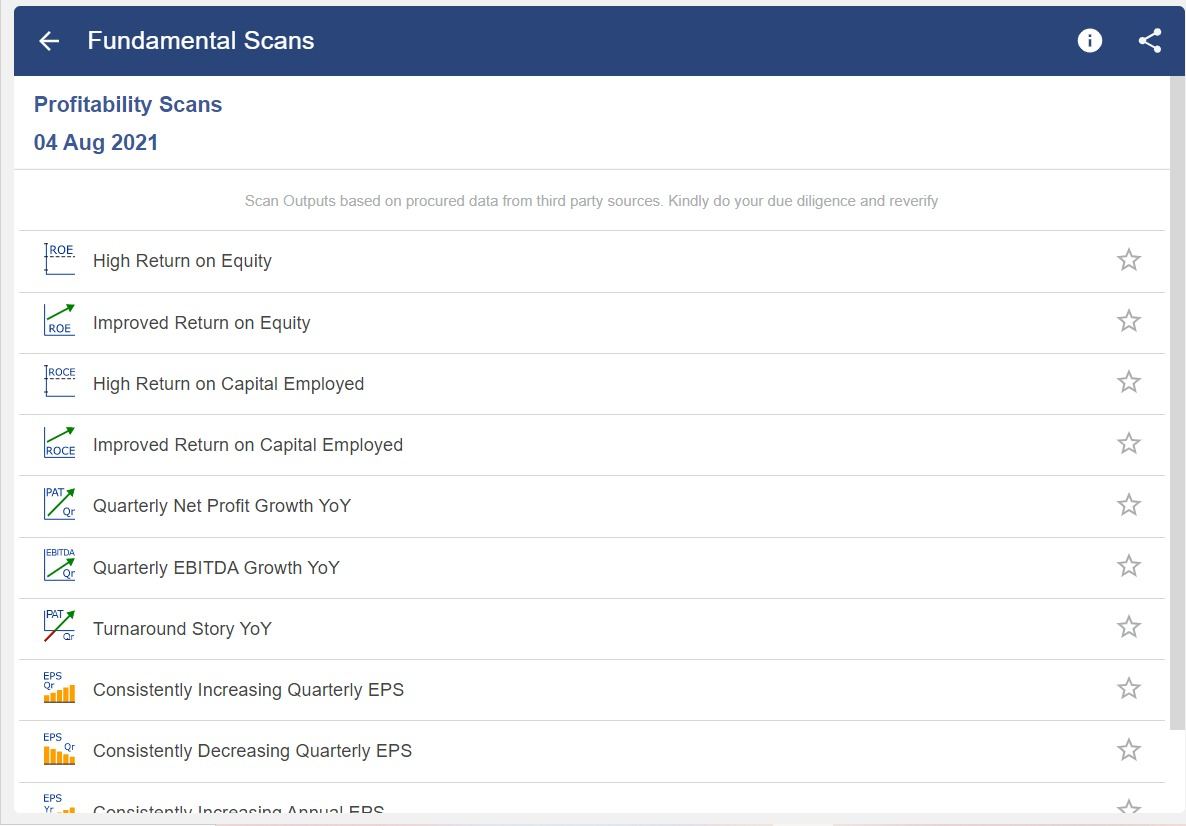
StockEdge has fundamental scans which filter out the companies that are financially sound for long term investing.
Bottomline:
As we have discussed above profitability shows the final performance of the company, i.e., how much profit the company has made. It also indicates how profitably the owner’s funds have been utilized in the company.
Happy Investing!


