In order to get a critical knowledge of a company’s efficiency with respect to its operations, i.e. inventory, debtors, creditors, assets, the company’s efficiency ratios need to be studied carefully. Efficiency ratios, also known as the turnover ratios or activity ratios or the performance ratios, tell us about how efficiently the company is churning its assets and generating cash from its sales. The various turnover ratios can be listed in the following manner-
Asset Turnover Ratio
Inventory Turnover Ratio
Debtor Turnover Ratio
Creditor Turnover Ratio
Working Capital Turnover Ratio
Fixed Assets Turnover Ratio
In this article, we are going to talk about the three important turnover ratios that tell us about the cash generating capacity of the company, i.e. inventory turnover ratio, debtor turnover ratio and creditor turnover ratios. All these three ratios can be better understood with the help of a concept called the “cash conversion cycle”. It tells us that in how many days the company is able to generate cash from the sales of its inventory.
| Table of Contents |
|---|
| How to calculate Cash Conversion Cycle? |
| Significance of Negative Cash Conversion Cycle |
| Turnover Ratio for various Industries |
| Bottom line |
How to calculate Cash Conversion Cycle?
What happens is that a company often buys its inventory on credit instead of paying cash immediately. This leads to increase in credit for the company which is termed as “accounts payable”. This is the easiest way for the company to finance its assets for a short period of time as the company does not have to pay any interest on it. Further, it sells its inventory on credit without receiving full cash from its customers. This leads to increase in debtors for the company which is termed as the “accounts receivable”.
Cash conversion cycle = Days Sales Outstanding + Days Inventory Outstanding – Days Payable Outstanding
Or
CCC = DSO + DIO – DPO
In simple words, days’ sales/receivables outstanding mean the number of days in which a company’s debtors will pay their dues to it. It is calculated by the following formula-
Days’ sales outstanding = (Average Accounts Receivable/Net Credit Sales) * 365
Days’ inventory outstanding means the number of days it takes for the company to sell its inventory. It is calculated by the following formula –
Days’ Inventory Outstanding = (Average inventory/Cost of goods sold) * 365
Days’ payable outstanding is the number of days in which the company will pay to its creditors. It is calculated by the following formula-
Days’ of payable outstanding = (Average creditors/Net credit purchase) * 365
Learn from Experts: Ratio Analysis- Learning Module
Let’s understand this with the help of an example.
Suppose, A is a retailer who trades in textile. Below is the data given for the F.Y. 2017 and 2016-
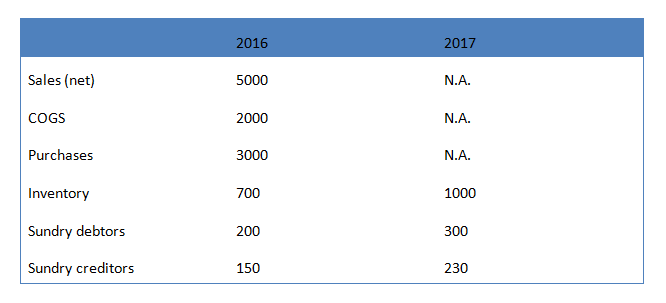
Average inventory = (700 + 1000)/2 = 850
Average Debtors = (200 + 300)/2 = 250
Average Creditors = (150 + 230)/2 = 190
Now, Days’ inventory outstanding = (Average Inventory/Cost of goods sold) * 365
= (850/2000) * 365
= 155.125 days
Days’ receivables outstanding = (Average Debtors/Net Sales) * 365
= (250/5000) * 365
= 18.25
Days’ payable outstanding = (Average creditors/Net purchases) * 365
= (190/3000) * 365
= 23.11
Cash Conversion Cycle = Days’ receivables outstanding + days’ inventory outstanding – days’ payable outstanding
=18.25 + 155.125 – 23.11
=150.265 days
Cash conversion cycle is an important ratio to understand the company’s performance at a glance. It tells us about how efficient the company is in managing its working capital. Lower the cash conversion cycle, better is the company at managing its inventory and converting it into cash.
This concept can also be better understood with something called ‘floats’. Floats are those businesses which accept as a huge ‘free’ cash flow from the customers as advances. We have used the term free here since the company is not obligated to pay interest on the advances. One should not always believe that a company with a negative cash conversion cycle is a good company. A company may be rich in cash but it may be inefficient in managing its other sections of the working capital. Hence, one should look for companies who have positive cash flows from operating activities.
Significance of Negative Cash Conversion Cycle
It may also be possible that a company has a negative cash conversion cycle. It signifies that
- The number of days in which the debtors pay to the company is less than the number of days in which the company has to pay to its creditors, i.e. it receives cash from its debtors before it has to pay to its creditors.
- It has the advantage of improved operating profits as it does not have to take short term loans to finance its current assets. Hence, it does not have to pay interest which improves the profits.
Turnover Ratio for various Industries
Cigarette Industry
In the following table, we are comparing the turnover ratios that is cash conversion cycle of cigarette companies in India.
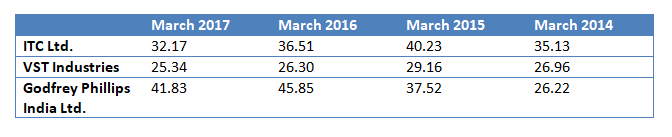 Cash conversion cycle of ITC Ltd. has been between 32 and 40 whereas that of VST Industries ltd. is 25 and 29 and of Godfrey Phillips India Ltd. is between 26 and 45 during the four-year period which indicates that VST Industries Ltd. has a better cash conversion cycle than ITC Ltd. and Godfrey Ltd. It means that VST Industries is able to sell and receive cash from its sales earlier than ITC Ltd. and even earlier than Godfrey Industries. Whereas ITC Ltd. has improved its cash conversion cycle in the four-year period, Godfrey Phillips India Ltd. has witnessed an increase in its cash conversion cycle from 26.22 days in March 2014 to 45.85 days in March 2016 which implies that the number of days it needs to convert its inventory into sales and generate cash has increased, which is not a good indication.
Also read : Moats vs Floats
FMCG companies
Below, we are going to compare the turnover ratios i.e. cash conversion cycle of FMCG companies.
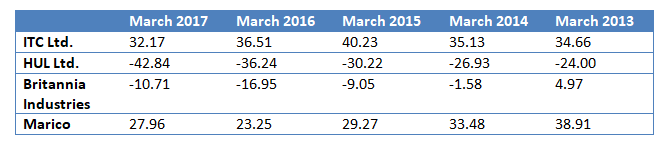
FMCG industry is one of those industries where inventory needs to be frequently churned. In the above table, we can see that HUL Ltd. has negative cash conversion cycle of 24 to 42 days which means that it could sell its inventory and generate cash from sales even 42 days before it has to make payments to its suppliers, which indicates an exceptionally good working capital management. Followed by HUL, we see Britannia Industries which has significantly improved its cash conversion cycle from a positive 4.97 days in March, 2013 to a negative 10.71 days in March, 2017.
Note- The companies in the same industry may vary from each other in some or the other way. For example, ITC is into Diversified businesses also such as cigarettes, paperboards and packaging, Information technology, hotels and agricultural business whereas HUL is only into the FMCG industry. So the structure of both the companies can be different but the basic idea of this article is to make the readers aware of the importance of different turnover ratios.
Retail Industry
The retail sector in India is one of the most important sectors of India. It accounts for about 14-15% of the GDP. It is growing at a very fast pace. In fact, India’s retail sector is ranked number one in A.T. Kearney’s 2017 Global Retail Development Index, which ranks the top 30 developing countries for retail investment worldwide.
The retail sector in India is of two types-
- Organized Retailing
- Unorganized Retailing
Organized retailing is one where operations of the retail store are managed in a systematic manner and all the products are available at one fixed place. They require a huge investment to conduct the business activity. For example, departmental stores, supermarkets, convenience stores etc. Whereas unorganized sector is the traditional method of retailing where only a limited number of products are available and the investment into these retail stores is also low.
Let’s take a look at an example.
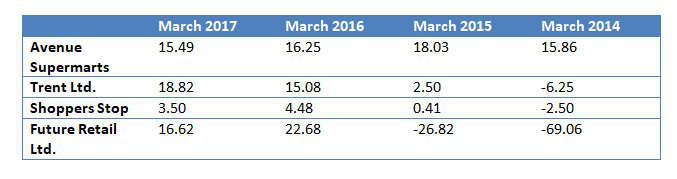
Cash conversion cycle of Shoppers Stop is the lowest among all the companies though it has increased over the last four years. From the table we see that cash conversion cycle of Trent Ltd. has gone from a negative 6 days to a positive 18 days. It means that earlier it used to receive cash from its sales 6 days before it made payments to its suppliers but now it pays its suppliers 18 days before it receives cash from its sales.
Pharmaceutical Companies
As per a report by Equity master, India ranks third in terms of volume and thirteenth largest in terms of value in the pharmaceutical market. Indian pharmaceutical industry enjoys a very important role in the world pharmaceutical industry. If we consider the estimations, the Indian pharmaceutical industry accounts for about 3.1-3.6% of the global pharmaceutical industry in terms of value and about 10% in terms of volume.
Talking about the working capital management of pharmaceutical companies, they have a high turnover ratios as compared to all other industries. A brief idea of the cash conversion cycle of different pharmaceutical industries is given below.
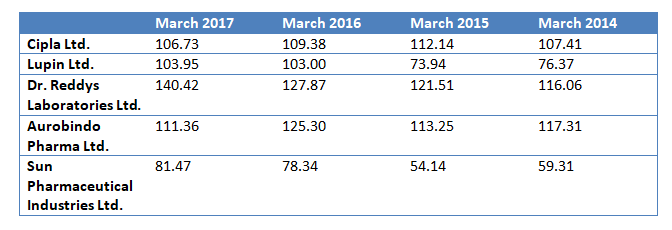
From the table we can say that the lowest cash conversion cycle is of Sun Pharmaceutical Ltd. with 59 to 81 days followed by Lupin Ltd. and Cipla Ltd. with almost equal cash conversion cycle between 76 and 106 days. Dr. Reddys Laboratories Ltd. has the highest cash conversion cycle among all the pharmaceutical companies.
Bottom line
One more important point that needs to be considered while analyzing the cash conversion cycle of various companies is that it depends on industry to industry. Not all companies in the same industry have the same structure. Suppose, a company has a high cash conversion cycle, it may be because it has influence over the suppliers and the suppliers are ready to allow such high credit period. Therefore, one must consider what the company is all about, what all businesses it does, how the company is structured, and various other aspects that revolve around the company.
In order to get the latest updates on Financial Markets visit stockedge.


Hello – I believe the data tables pertaining to FMGC and Pharma are interchanged. Please review and make necessary updates.
Hi,
Thank you for your feedback. We have made the changes.
Keep Reading!
I would like to thnkx for the efforts you’ve put in writing this blog. I am hoping the same high-grade site post from you in the upcoming as well. Actually your creative writing skills has inspired me to get my own website now. Actually the blogging is spreading its wings fast. Your write up is a good example of it.