Did you know? The Nifty 50 Index tracks the top 50 companies listed on the National Stock Exchange (NSE) of India.
It covers 14 key sectors like IT, banking, and energy. Nifty 50 index, which was launched in 1996, represents over 60% of India’s market value, thus offering a clear picture of India’s economic health.
The Nifty 50 acts as a benchmark to measure market performance and help investors to make investment decisions. It’s commonly used in mutual funds, ETFs, and other financial products, helping individuals easily invest in India’s biggest companies.
The Nifty 50 helps traders to follow overall market trends and growth. In this blog, let us discuss some interesting things that every trader and investor in the Indian Stock Market should know about the Nifty 50 Index-
What is the NIFTY 50 Index?
The Nifty 50 can be thought of as a snapshot of the overall health of the Indian stock market. When the Nifty 50 goes up, it generally indicates that the Indian economy is doing well. It’s an important benchmark for investors, traders, and financial institutions to track the performance of the Indian stock market.
The NIFTY 50’s performance is influenced by various factors such as corporate earnings, macroeconomic indicators, and global market trends. It serves as a reliable gauge for investors who want to seek exposure to India’s top-performing companies and is a cornerstone of the Indian financial markets.
A Brief History of the NIFTY 50
In the early 1990s, stock trading in India was manual, conducted on physical floors, and prone to manipulation due to weak oversight and lack of transparency. Settlements took weeks, leading to delays and lost certificates, impacting investor confidence.
The Harshad Mehta scam of 1992 exposed inefficiencies in the financial system, including outdated technology and lack of regulation. This prompted the Indian government and SEBI to modernize the market structure.
In response, the Pherwani Committee (1991) recommended the introduction of screen-based electronic trading, enabling real-time, transparent transactions. The establishment of the National Stock Exchange (NSE) in 1992 marked a shift toward a more efficient, technology-driven market, addressing the flaws highlighted by the scandal.
How is the NIFTY 50 Index Composed?
Let’s take a closer look at how the NIFTY 50 is composed:
- Criteria for Inclusion
To be included in the NIFTY 50 Index, a stock must meet the following criteria:
- Market Capitalization: The stock must rank among the top companies in terms of free-float market capitalization.
- Liquidity: The stock must have sufficient liquidity, determined by its average impact cost (trading efficiency). It should have an average impact cost of 0.50% or less for 90% of trades in the past six months.
- Trading Frequency: The stock must have been traded on at least 100% of the trading days in the past six months.
- Eligibility: Only equity shares that are part of the F&O (Futures & Options) segment are considered.
- Index Rebalancing : Index rebalancing ensures that the NIFTY 50 reflects the latest market trends and includes only the most relevant and liquid companies.
- Liquidity Criteria: The focus on liquidity ensures that the NIFTY 50 is composed of stocks that contribute to the efficiency of liquidity-driven markets in India.
- Sector Representation
The NIFTY 50 represents companies across various sectors to reflect the overall performance of the Indian economy.
Major sectors include financial services, information technology, energy, consumer goods, healthcare stocks, and infrastructure stock as shown below-
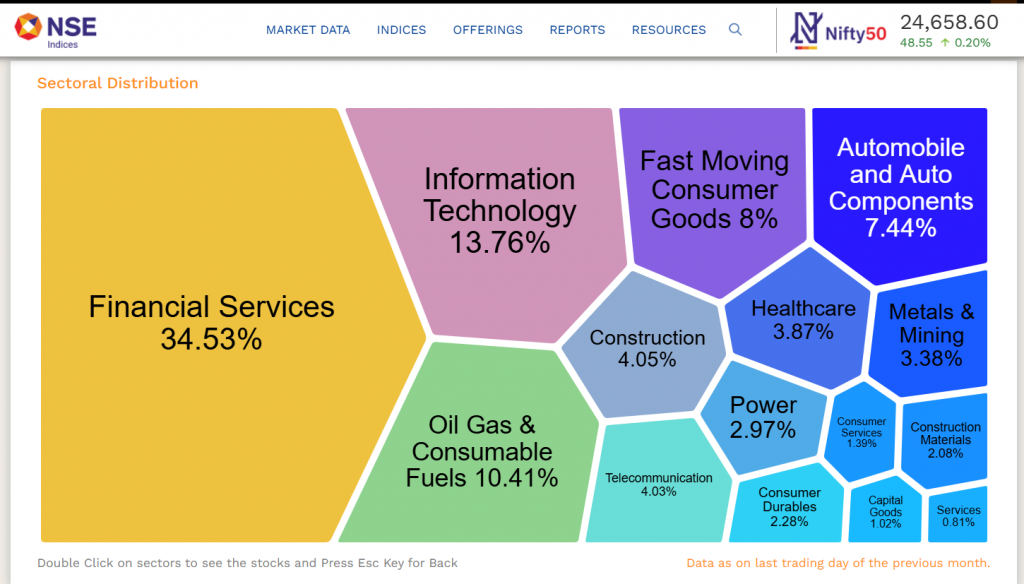
The weightage of each sector depends on the free-float market capitalization of the companies in that sector.
- Calculation Method
The NIFTY 50 Index is calculated using the free-float market capitalization-weighted method. Free-float shares are the shares of a company that are readily available for trading in the public market. Shares held by promoters, governments, insiders, and other entities that are not actively traded are excluded.
Market Capitalization is calculated as
Market Capitalization (Free-Float) = Share Price x Number of Free-Float Shares
This method provides a more accurate reflection of a company’s true market value, as it only considers the shares that are actively traded by investors. Companies with larger free-float market capitalizations have a greater influence on the overall index performance.
Understanding NIFTY 50’s Performance
The NIFTY 50 often mirrors global indices during periods of economic turbulence, showcasing its interrelation with international markets. Over the last two decades, the NIFTY 50 has delivered an average annual return of about 12-15%, making it one of the top-performing indices among emerging markets!
Let us have a look at the Nifty 50’s historical trends and recent developments:
Historical Trends
Investors have consistently relied on the NIFTY 50 for long-term capital appreciation to ensures India’s rapid economic growth.
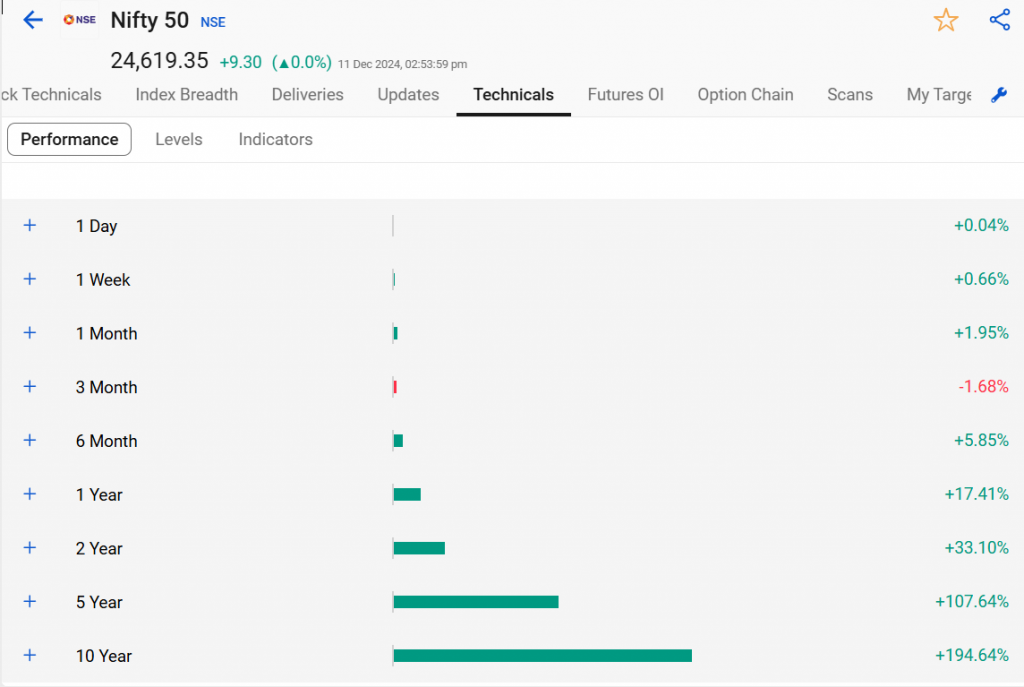
With a relatively stable Beta, the NIFTY 50 offers investors a balanced risk-reward ratio compared to other market indices. Over the years, as shown above, the NIFTY 50 has shown consistent growth, reflecting the overall rise of India’s economy and corporate sector. The index has provided strong returns, thus making it an attractive choice for investors who want to seek exposure to the Indian Stock Market.
Often, the performance of the Nifty 50 reflects economic cyclicality, with sectors like consumer goods and technology leading during periods of growth.
Over time, sectors such as technology, finance, and consumer goods have become dominant in the NIFTY 50, contributing significantly to its growth. For example, the rise of tech stocks like Infosys, TCS, and HDFC Bank have helped drive the index upwards.
Recent Developments
In recent years, the NIFTY 50 has seen a few key developments that have impacted its performance:
Recent sectoral rotation has increased the weightage of technology and financial services, reflecting India’s evolving economic landscape.
The Volatility Index (VIX) often moves inversely to the NIFTY 50, serving as a gauge for market uncertainty.
With the rise of digitalization and technology, the tech sector has gained more weight in the NIFTY 50. Companies like Infosys, Tata Consultancy Services (TCS), and Wipro have outperformed other sectors, pushing the index higher.
Market Breadth
The market breadth of the NIFTY 50 has historically shown a strong correlation with India’s overall economic expansion, showcasing a powerful participation from multiple sectors.

Index funds based on the NIFTY 50 are an integral part of financial planning, offering low-cost and efficient exposure to India’s top companies
How to Invest in the NIFTY 50 Index?
One can mainly invest in the Nifty 50 through ETFs or Derivatives Trading-
- ETFs
ETFs are investment funds that trade on stock exchanges just like individual stocks. They track the performance of a specific index, in this case, the NIFTY 50. By investing in the NIFTY 50 ETF, you buy a some of the stocks that mirror the composition of the NIFTY 50 index.
ETFs provide instant diversification across 50 of India’s largest companies. Also, they have lower expense ratios than actively managed funds.
ETFs, a foundation of passive investing, offer a cost-effective way to get exposure to the NIFTY 50 without the need for active portfolio management
Many ETFs tracking the NIFTY 50 also provide investors with a steady dividend yield, enhancing their overall returns.
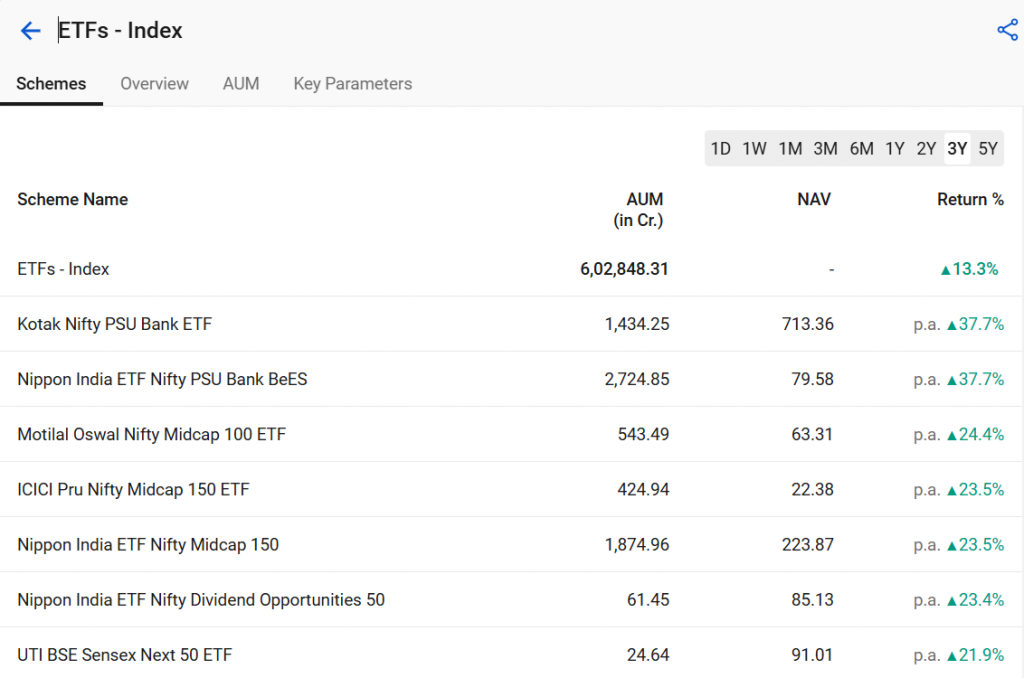
Some of the good performing ETFs are –
- Nippon India ETF Nifty 50 BeES
- ICICI Prudential Nifty 50 ETF
- HDFC Nifty 50 ETF
- UTI Nifty 50 ETF
- SBI Nifty 50 ETF
While ETFs closely follow the index, investors should consider the tracking error as it impacts the fund’s alignment with the NIFTY 50’s performance
- Derivatives Trading
Derivatives are financial contracts that derive their value from an underlying asset, in this case, the NIFTY 50 index.
Futures: Contracts that obligate the buyer to purchase (or the seller to sell) the underlying asset (NIFTY 50) at a predetermined price and future date.
Options: Contracts that give the buyer the right (but not the obligation) to buy (call option) or sell (put option) the underlying asset at a specific price (strike price) within a certain timeframe.
Whether the market is in an uptrend, downtrend, or sideways, traders can implement various types of options strategies.
When options traders get a bullish market, then options strategies like naked calls, bull call spreads, and long call butterfly spreads can be implemented.
When options traders get a bearish market, then options strategies like naked puts, bear call spreads, and bear put spreads can be implemented.
When the market consolidates, options strategies such as straddle, strangle, and butterfly spreads can be implemented.
Why Should Market Participants Know About the NIFTY 50?
Market participants should know about the NIFTY 50 for the following reasons:
- The NIFTY 50 is a widely followed benchmark index that reflects the overall health and direction of the Indian stock market.
- Investors can directly invest in individual stocks within the index or utilize ETFs and derivatives to get some exposure to the NIFTY 50.
- Investors can use the index to hedge their portfolios against market downturns or to implement trading strategies that capitalize on market movements.
- The NIFTY 50 serves as an important economic indicator, reflecting the overall economic growth and performance of the Indian economy.
- Analysts and investors use the NIFTY 50 to analyze market trends, identify potential investment opportunities, and make informed trading decisions.
- NIFTY 50 act as an indicator for market sentiment and provides critical insights into investor confidence and economic expectations
- The NIFTY 50 helps investors manage systematic risk while reducing unsystematic risk through its diversified portfolio
Conclusion
The NIFTY 50 plays an important role in the Indian stock market. Understanding its composition, movements, and implications is crucial for any market participant, whether they are individual investors, institutional investors, or traders.


