Elearnmarkets - Financial Market Learning
  • Courses
  • Webinars
  • Stories
  • Language
    • English
    • Hindi
    • Bengali
No Result
View All Result
Get Free Course
  • Basic Finance
  • Derivatives
    • Futures
    • Options
  • Financial Planning
  • Fundamental Analysis
  • Technical Analysis
  • Mutual Funds
  • Marketshala
  • Miscellaneous
Elearnmarkets - Learn Stock Market, trading, investing for Free
  • Courses
  • Webinars
  • Stories
  • Language
    • English
    • Hindi
    • Bengali
No Result
View All Result
Get Free Course
Elearnmarkets - Learn Stock Market, trading, investing for Free
No Result
View All Result
Home Basic Finance
Understand the Relationship Between Demand And Supply 1

Understand the Relationship Between Demand And Supply

Elearnmarkets by Elearnmarkets
August 14, 2023
in Basic Finance
Reading Time: 6 mins read
0
17.7k
VIEWS
Share on FacebookShare on XShare on WhatsApp

Demand, Supply, Consumption Patterns and the price level are all inter-related to each other. One major problem attached to projecting prices using the relationship between demand and supply pattern is the difficulty in quantifying demand. There is no way to determine the quantity demanded at any given level of prices.

Table of Contents
Analyzing demand curves
Understanding the relationship between demand and supply
Fixed Supply Situations
Can increase in consumption and fall in demand happen simultaneously?

Supply, on the other hand, can be determined easily to a certain extent, for example in case of perishable goods or non-storable goods, based on the production or the stock statistics.

There can be certain exceptions; however, in most of the cases, the supply can be determined as compared to the quantity demanded.

demand supply basics

Analyzing demand curves

The only way to determine quantity demanded is through inference of demand curves through a detailed study of the historical consumption pattern and the price data. It is an easy process when the quantity demanded is stable in nature. On the other hand, frequent changes in the pattern of quantity demanded, makes this methodology almost impossible. This difficulty in the quantification of demand can be circumvented by considering consumption figures as a proxy to carry on with the workable analysis of projecting prices. This assumption is wrong, but in order to get a workable figure, we need to know the conceptual mistakes involved in this.

Let us understand the following difference:

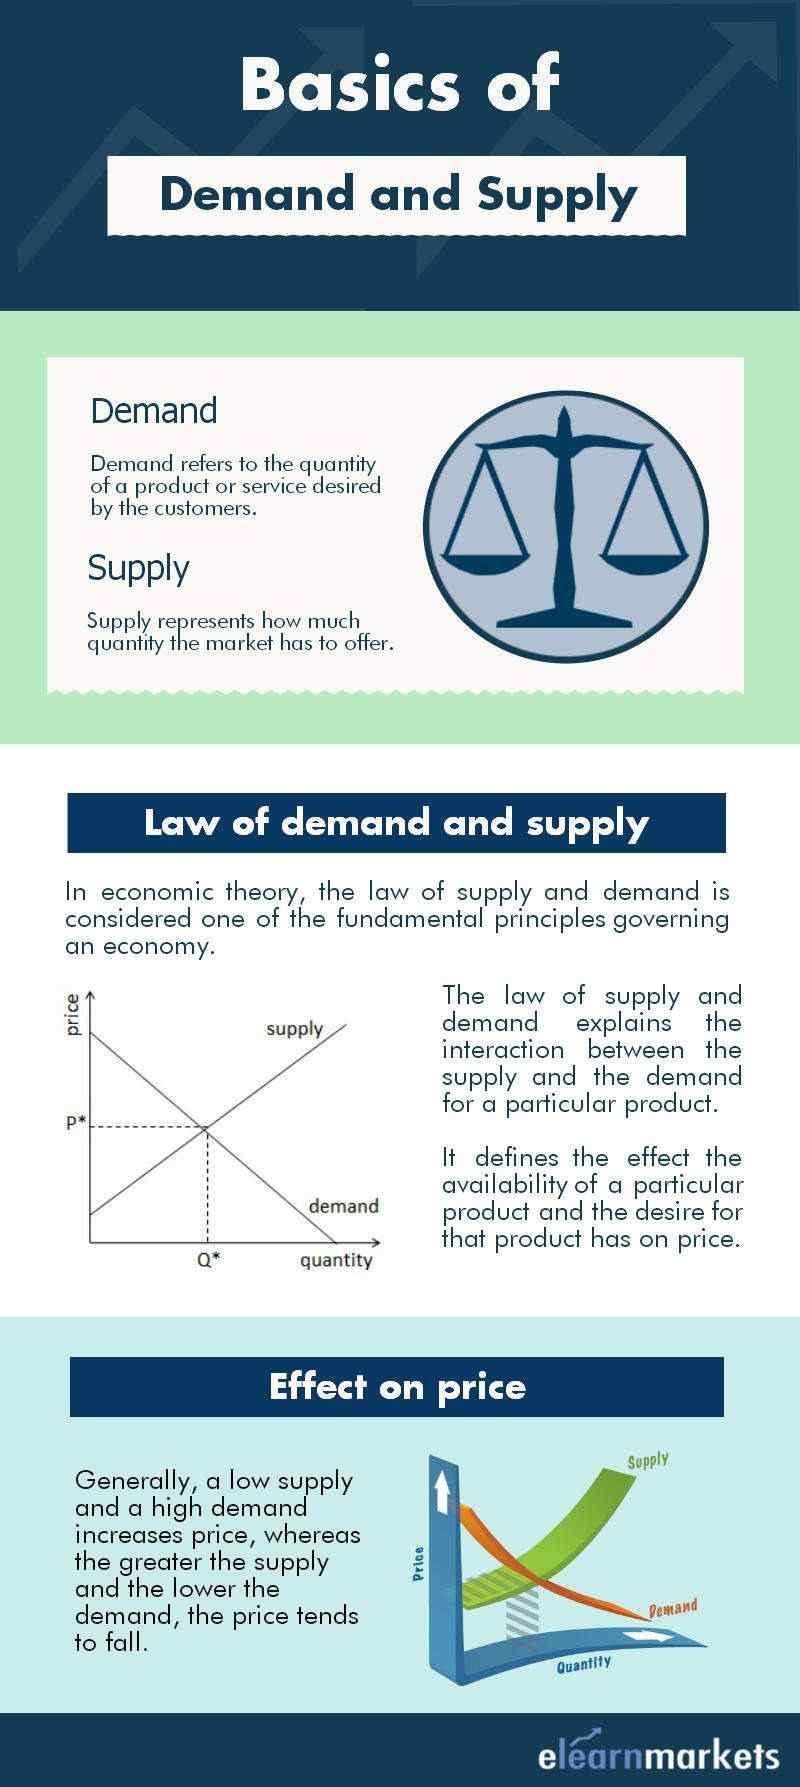
Consumption is the amount of goods used and is determined by the price which in turn is determined by the demand and supply factors.

Demand refers to the amount of goods that will be used at any given price level and along with supply determines the price.

Now look at the figures below:

demand chart

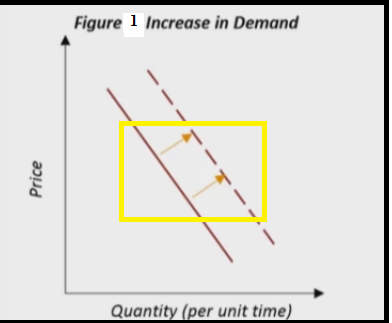
In Fig 1 above, we see an increase in quantity demanded which means that more will be consumed at any given price level. Whereas a mere price decline can increase consumption.

consumption chart

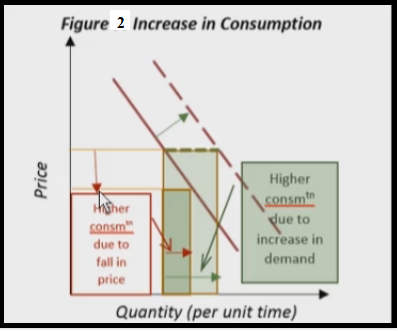
In Fig 2 above, you can see an increase in quantity demanded, wherein the demand curve shifts to the right and at a given price level, there is higher consumption due to increase in quantity demanded.

Whereas you will see that on the same curve, with the decline in prices, an increase in the consumption level with the increased prices.

Increase in quantity demanded can be induced by an increase in disposable income, the price of the substitute goods falling etc. but not by definition due to the price of the goods. Changes in the price itself will not cause a shift in the curve, it will cause changes in the consumption level.

Understanding the relationship between demand and supply

demand and supply

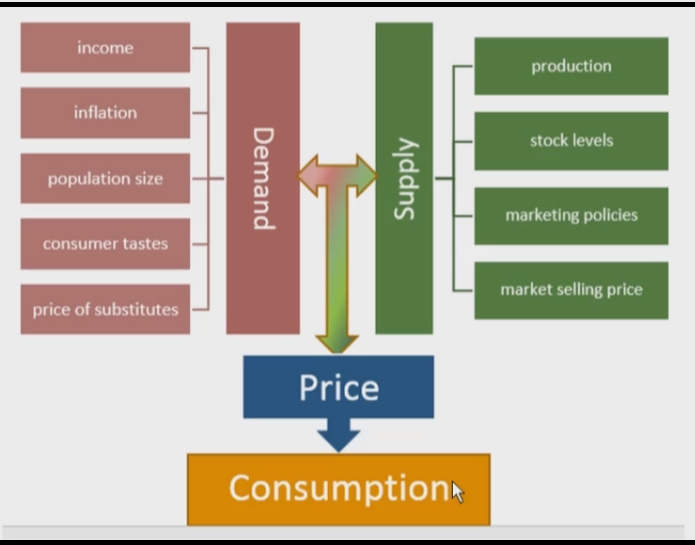
Considering the above figure, we can say the following:

  • Consumption is the consequence of price.
  • Demand is the determinant of price.

Hence, the use of consumption as a proxy for demand is ERRONEOUS as it is determined by the relationship between demand and supply. Similarly, the law of demand works in the stock market.

Also Read: Basic Toolkit for Stock Market Beginners

Fixed Supply Situations

Let us analyze a situation wherein supply is fixed, for example in case of non-storable perishables.

fixed supply

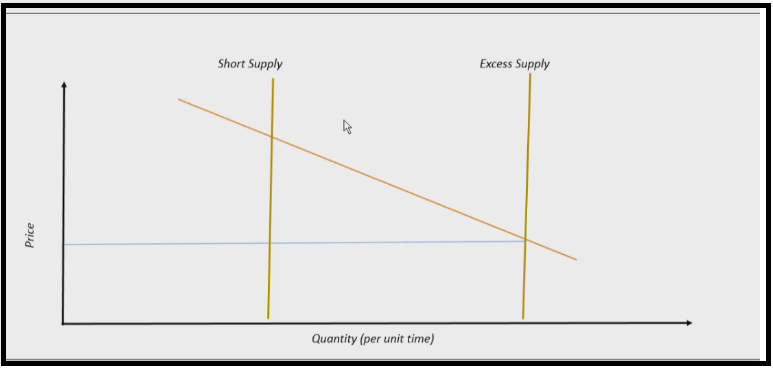
In the figure above, consumption reflects supply and not by the quantity demanded. For example, consumption of ripe mangoes during peak harvest season.

During the summer days, when there was excess supply, mangoes were being sold @Rs. 20/kg in a particular area. In the previous year (2016) the mangoes were selling @Rs. 50/kg in the same area. The consumption was higher in 2017 as compared to the consumption in the year 2016.

But was the quantity demanded any less in 2016? Did the demand for mangoes decrease in 2017 as compared to 2016?

Well the quantity demanded did not change in any of the two year’s, what changed was the supply. The year 2017 was the excess supply year and  in the year 2016, the supply of mangoes was limited

 This implies that consumption is solely dependent on the supply and will remain the same irrespective of the shift in the demand curve.  Thus, the price is the variable that brings the equilibrium.

Increase in consumption will mean a rightward shift in the supply curve a rightward shift in supply is a bearish development.

Can an increase in consumption and a fall in demand happen simultaneously?

In order to understand the above statement, you can watch the video below:

Post our discussion, it is always recommended to consider the factors influencing the demand in our price forecasting analysis. Despite the problem at the quantification level, we should consider the impact of quantity demanded on the prices qualitatively and through model projections.

Hope we have been able to justify the relationship between demand and supply in the most simple manner. In case of any queries, do not forget to comment below.

Visit Stockedge to get various Fundamental and Technical Scans of Financial Markets.

Tags: basicdemand and supplyeconomicsenglish
ShareTweetSend
Get Kotak Offer Get Kotak Offer Get Kotak Offer
Previous Post

Basic tenets of Elliott Wave Principle

Next Post

Why is Cash Conversion Cycle Important?

Elearnmarkets

Elearnmarkets

Elearnmarkets (ELM) is a complete financial market portal where the market experts have taken the onus to spread financial education. ELM constantly experiments with new education methodologies and technologies to make financial education effective, affordable and accessible to all. You can connect with us on Twitter @elearnmarkets.

Related Posts

How is standard deviation used in mutual fund
ETFs & Mutual Funds

How is Standard Deviation Used in Mutual Fund

April 22, 2025
358
Ways to Make Trading More Transparent
Cryptocurrency

Under the Crypto Hood: 5 Ways to Make Trading More Transparent

May 5, 2025
80
options trading books
Basic Finance

Top 5 Options Trading Books for Beginners

March 19, 2025
859
The Rise of Meme Coins Like Trump Coin and Why They May Be a Good Investment 2
Cryptocurrency

The Rise of Meme Coins Like Trump Coin and Why They May Be a Good Investment

February 26, 2025
167

Leave a Reply Cancel reply

Your email address will not be published. Required fields are marked *

Disclaimer

Elearnmarkets (Kredent InfoEdge Pvt. Ltd.) is a SEBI-registered Research Analyst (RA) entity (SEBI Registration No.: INH300007493). The information provided in this article is for educational and informational purposes only and should not be considered as an offer to buy or sell any securities or investment products.

The stocks, securities, and investment instruments mentioned herein are not recommendations under SEBI (Research Analysts) Regulations, 2014. Readers are advised to conduct their own due diligence and seek independent financial advice before making any investment decisions.

Investments in securities markets are subject to market risks. Please read all related documents carefully before investing. Investing in Equity Shares,
Derivatives, Mutual Funds, or other instruments carry inherent risks, including potential loss of capital. Elearnmarkets (Kredent InfoEdge Pvt. Ltd.) does not provide any guarantee or assurance of returns on any investments. Past performance is not indicative of future performance.

Elearnmarkets Logo

Follow Us

Facebook-f X-twitter Instagram Linkedin-in Youtube Telegram

Register on Elearnmarkets

Continue your financial learning by creating your own account on Elearnmarkets.com

Register Free Account

Download App

Playstore logo
Download on app store

Categories

  • Basic Finance
  • Derivatives
  • Financial Planning
  • Fundamental Analysis
  • Technical Analysis
  • Mutual Funds
  • Miscellaneous

Popular On Elearnmarkets

  • Market Superheroes:
  • Vivek Bajaj
  • Chetan Panchamia
  • Ashish Kyal
  • Premal Parekh
  • Abhijit Paul
  • Jegan
  • Sivakumar Jayachadran
  • Jyoti Budhia
  • Vivek Gadodia
  • Vishal Mehta
  • Piyush Chaudhry
  • Santosh Pasi
  • Gomathi Shankar
  • Market Superheroes:
  • Vivek Bajaj
  • Chetan Panchamia
  • Ashish Kyal
  • Premal Parekh
  • Abhijit Paul
  • Jegan
  • Sivakumar Jayachadran
  • Jyoti Budhia
  • Vivek Gadodia
  • Vishal Mehta
  • Piyush Chaudhry
  • Santosh Pasi
  • Gomathi Shankar
  • Courses:​
  • Options Trading
  • Dow Theory
  • Momentum Trading
  • Stock Investing
  • Harmonic Chart Patterns
  • Algo Trading
  • Elliot Wave Theory
  • Advanced Excel
  • Cryptocurrency
  • NSE Certification Course
  • Courses:​
  • Options Trading
  • Dow Theory
  • Momentum Trading
  • Stock Investing
  • Harmonic Chart Patterns
  • Algo Trading
  • Elliot Wave Theory
  • Advanced Excel
  • Cryptocurrency
  • NSE Certification Course
  • Webinars:
  • Bank Nifty Scalping
  • Intraday Trading Strategies
  • Options Trading Strategies
  • Options selling
  • Price Action
  • Relative Strength
  • Tax Planning
  • Options Buying
  • Growth Stocks
  • Portfolio Management
  • Risk Management
  • Renko Charts
  • Crude Oil
  • Traders Psychology
  • Moving Average
  • Multibagger Stocks
  • Free Learning Modules:
  • Intraday Trading
  • Options Scalping
  • Swing Trading
  • Financial Modelling
  • RSI Indicator
  • Bollinger Bands
  • Pricing of Futures
  • Personal Finance
  • Initial Public Offerings (IPO)
  • Value Investing
  • Technical Indicators
  • Candlesticks
  • Chart Patterns
  • Option Greeks
  • ELSS Funds
  • Banking and Insurance
  • Real Estate
  • Gold
  • Book Summaries:
  • Rich Dad Poor Dad
  • Psychology of Money
  • The Intelligent Investor
  • The Richest Man in Babylon
  • Think and Trade Like a Champion
  • Value Investing and Behavioural Finance
  • Trading in the Zone
  • Learn to Earn
  • Book Summaries:
  • Rich Dad Poor Dad
  • Psychology of Money
  • The Intelligent Investor
  • The Richest Man in Babylon
  • Think and Trade Like a Champion
  • Value Investing and Behavioural Finance
  • Trading in the Zone
  • Learn to Earn
  • Tools:
  • CAGR Calculator
  • SIP Calculator
  • eLearnOptions
  • Future Value Calculator
  • Present Value Calculator
  • Atal Pension Yojana
  • Cost of Delay Calculator
  • Become a Crorepati
  • Tools:
  • CAGR Calculator
  • SIP Calculator
  • eLearnOptions
  • Future Value Calculator
  • Present Value Calculator
  • Atal Pension Yojana
  • Cost of Delay Calculator
  • Become a Crorepati

© 2025 Elearnmarkets. All Rights Reserved

  • Visit Elearnmarkets
  • Courses
  • Webinars
  • Financial Guides
  • Get Free Counselling
  • Visit Elearnmarkets
  • Courses
  • Webinars
  • Financial Guides
  • Get Free Counselling

Download Our App

No Result
View All Result
  • Article Categories
    • Basic Finance
    • Derivatives
    • Financial Planning
    • Fundamental Analysis
    • Technical Analysis
    • ETFs & Mutual Funds
    • Marketshala
    • Miscellaneous
  • Language
    • Hindi
    • Bengali
    • English
  • Courses
  • Webinars
  • Stories
Get Free Course

© 2024 Elearnmarkets All Rights Reserved

Guide to Basics of Stock Investing
Learn to interpret the financial performance and health of a company.
Download Guide For FREE
Trading Mentorship Program