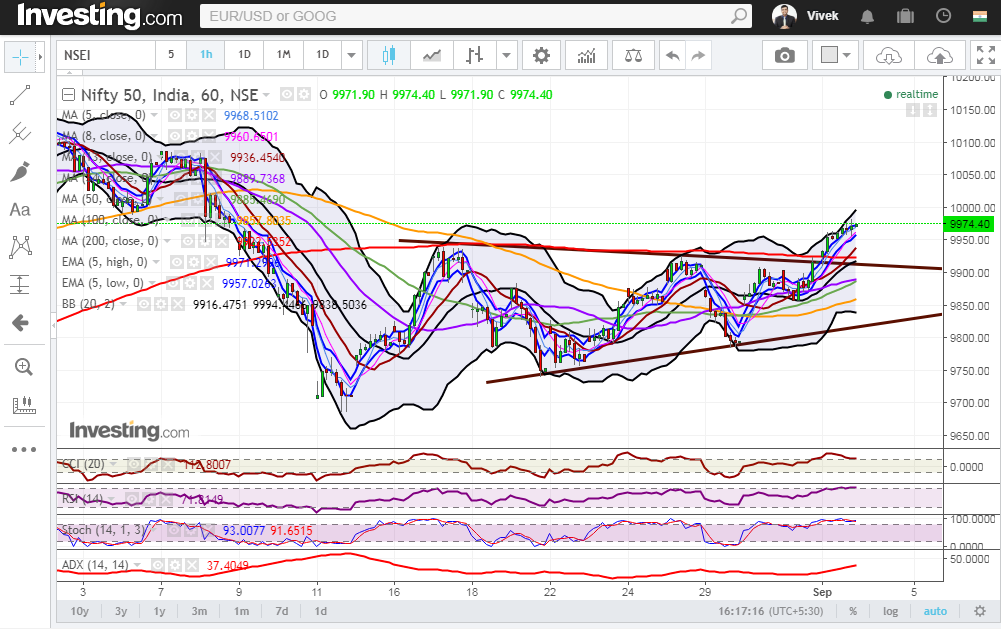
Nifty (Close 9974.4) : Nifty breached an importance resistance of 200 Hourly moving average (presently at approx. 9922.5) and breaks out of the short-term Symmetrical triangle in the very first hour, post which it witnessed one-sided rally.
Hourly Technical:
Nifty has closed above all short term moving average and there is a high possibility that this rally may further continue.
The probable support in the hourly chart comes at 8 hour moving average (presently at approx.9960.7), 13 hour moving average (presently at approx.9936.5) and 200 hour moving average (presently at approx.9922.5). On the upside, Nifty may face resistance at upper Bollinger line (presently at approx.9994.4) and 78.6% retracement (presently at approx. 10041.5) of the down move from approx. 10137.9 to approx. 9687.5.
Hourly CCI, Stochastic, RSI are in the overbought zone. Moreover, the rising ADX indicates gain of upside momentum. Overall, Nifty remains bullish in the Hourly chart.
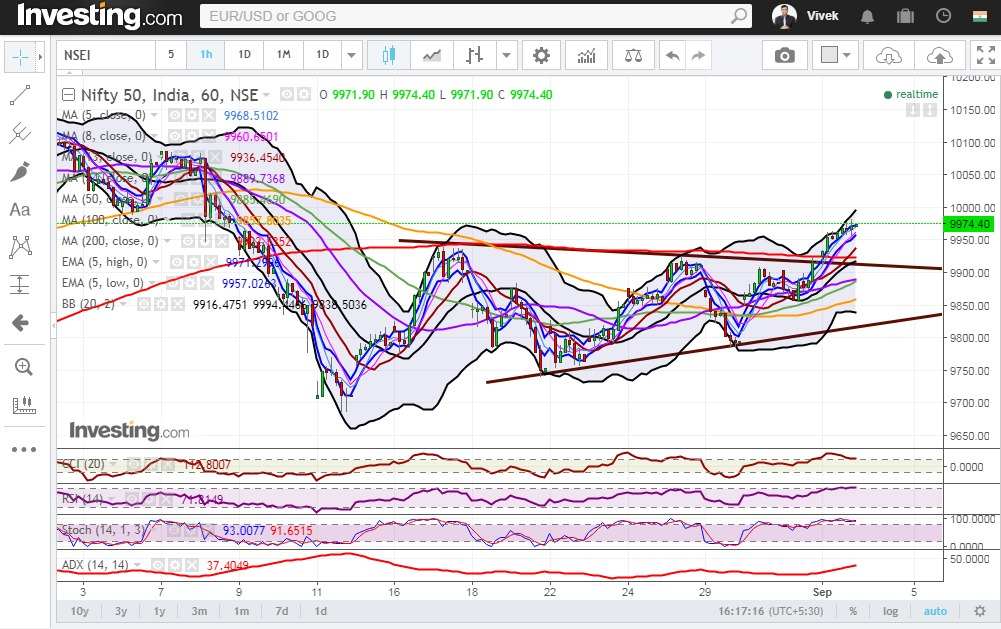
Figure: Hourly Chart
Daily Technical:
Nifty in the Daily chart has turned bullish and it seems that the bulls are once back in the game. Even in the Daily chart, Nifty has closed above most moving averages.
The probable support in the daily chart comes at 5 Day High EMA (presently at approx.9931.4), 34 DMA (presently at approx.9920) and 20 DMA (presently at approx.9885.2). The probable resistance in the daily chart comes at upper Bollinger line (presently at approx.10077.5).
The daily RSI and CCI are still in the neutral zone but gradually moving towards the upper bound of the normal zone. Daily stochastic has entered the overbought zone. However, the declining ADX indicates lack of momentum. Overall, Nifty remains bullish in the Daily chart.
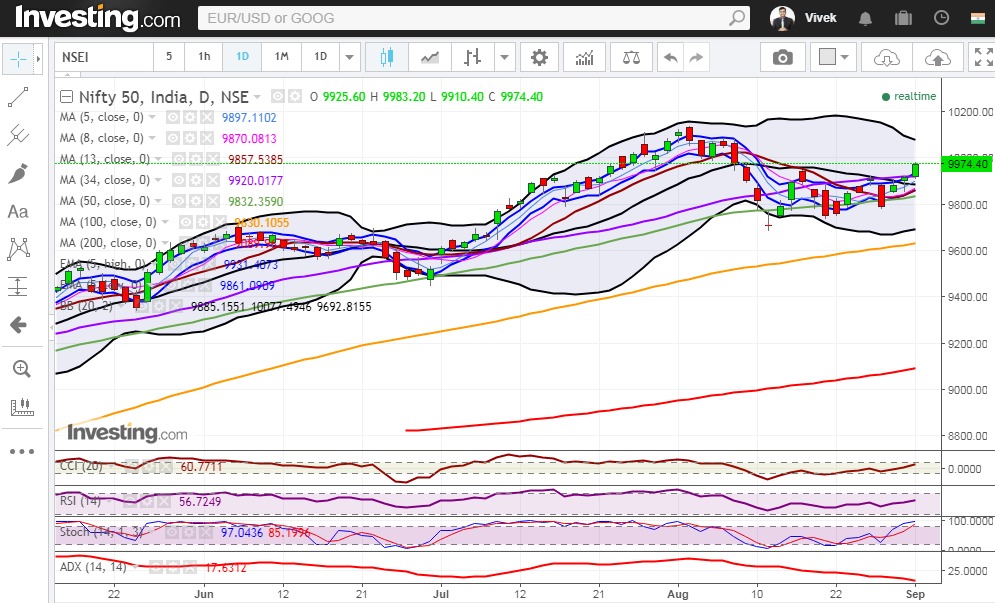
Figure: Daily Chart
Weekly Technical:
In the weekly chart, the overall bearish view due to presence of long red candle last week has almost negated. The Nifty has closed just above 5 week High EMA (presently at approx. 9966.5) which is a sign of strength in the weekly chart.
Weekly CCI, RSI, slow stochastic are close to the upper bound of the normal zone. Overall, Nifty remains neutral to bullish in the weekly timeframe.
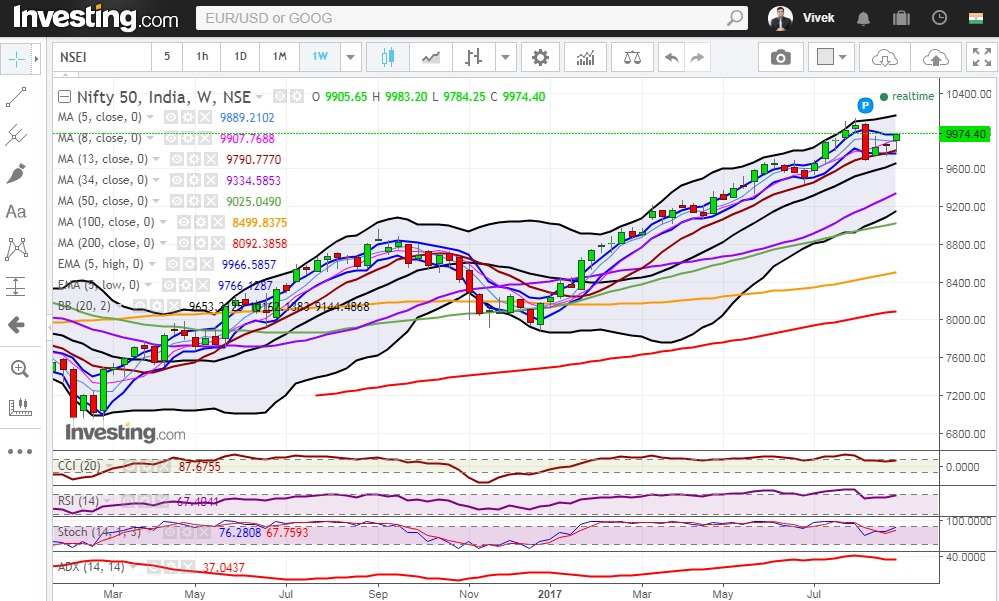
Figure: Weekly Chart
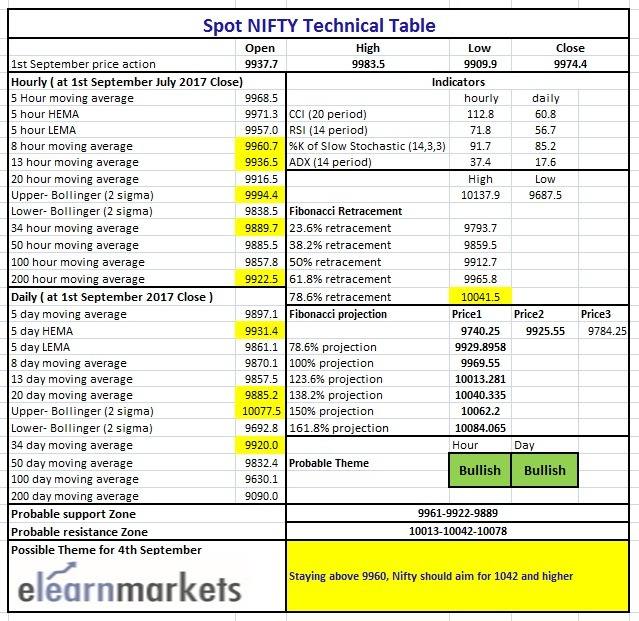
Figure: Tech Table
